Introduction
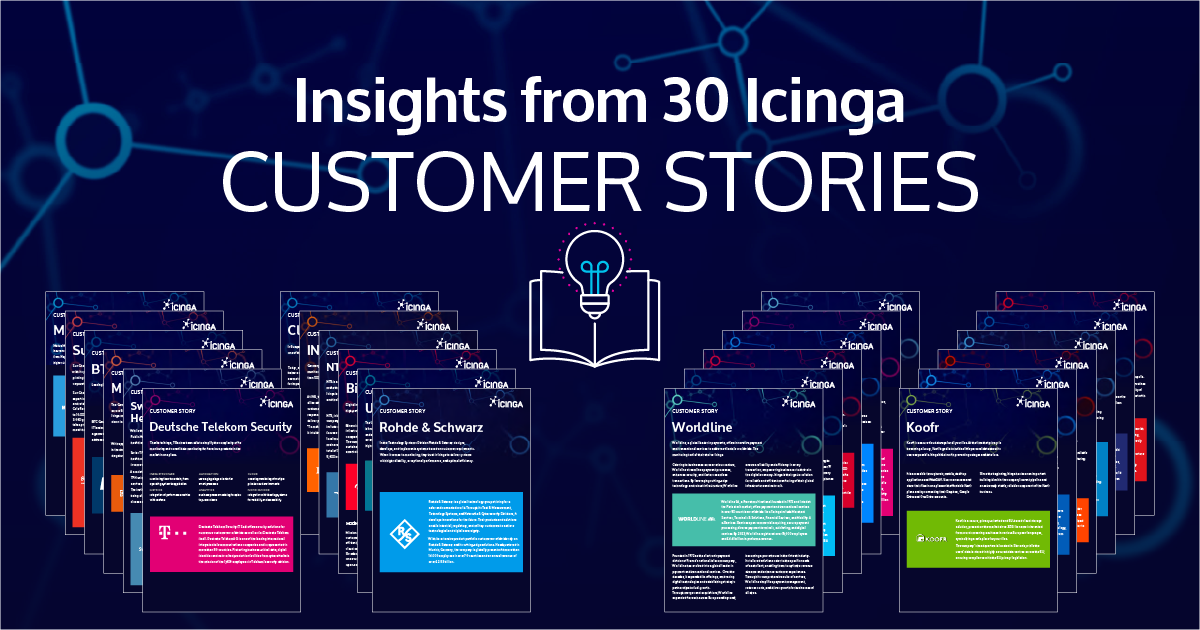
Thirty organizations have documented their Icinga deployment with us on the record, with names, architecture and numbers. The published deployments cover finance, telecom, manufacturing, public services, research and managed services. They range from around 500 hosts to more than 50,000 server units, run by teams of three people up to platform groups serving 8,000 internal users.
This post has two parts. First, five patterns that turn up in every sector, regardless of size. Then the deployments themselves, sector by sector, followed by a table with the numbers for all thirty.
Part 1: Five patterns across all 30 deployments with Icinga
These five hold across a bank, a hospital, a drugstore chain, and a radio network in the outback. They are the reason the same tool fits environments that otherwise share nothing.
Scale is a function of architecture, not headcount.
DATEV, a German software provider for tax and accounting firms, monitors more than 50,000 server units by chaining satellites so each one acts as a gateway into the next network zone. Müller, a drugstore chain with 900 branches in seven European countries, runs its monitoring with three people. The pattern behind both: satellites where the network or the tenant boundary requires them, and configuration that is generated rather than written by hand. Per-deployment figures are in the table at the end.
Automation is what makes small teams viable.
SVA, a German systems integrator, onboards a new customer from a single form: Ansible deploys the full stack including Icinga, and the environment is monitored within hours. Vimar wired Jenkins pipelines into the Icinga API, so new virtual machines register themselves and their checks as part of provisioning. Mutua Madrileña, Spain’s largest non-life insurer, splits its Ansible host configuration into a standardized section and a per-machine threshold section. The City of Cologne reports that work which used to take days now takes about an hour.
Flexibility shows up as integration, not as options.
Clear Channel uses parent-child host dependencies so a failed router does not generate a hundred child tickets, and Apply Rules removed 80 to 90 percent of the remaining noise. The Leibniz Supercomputing Centre monitors its SuperMUC-NG supercomputer through the same hierarchy, down to catching a failing cooling pump before the machine overheats. GoldNet exports metrics via OpenTelemetry into VictoriaMetrics. Rohde & Schwarz builds its own commercial monitoring product on top of Icinga and releases the check plugins under GPL.
Transparency turns monitoring into a service.
At DATEV, 8,000 employees have read access to Icinga Web; teams no longer pick their own tooling, they file a request and the platform team handles it. NTE, a Norwegian utility owned by 19 municipalities, shows live Icinga status to its B2B customers through a customer portal. SVA gives customers a green-or-red view of their own environment and proves SLA compliance with monthly availability reports.
Open-source independence is a selection criterion, not a footnote.
GoldNet moved to Icinga when Opsview shifted from open source to a commercial model. Rohde & Schwarz runs projects with 15+ year lifecycles where replacing a component means recertification, so building and patching the software in-house matters more than any feature. Mutua Madrileña set GPL licensing and platform independence as hard requirements before its evaluation started. ACP IT Solutions evaluated PRTG and Checkmk first; RGK4IT evaluated Zabbix.
Part 2: The deployments, sector by sector
Five sectors, in the same order as the table at the end. Each section names what the environment demanded and what the team built in response.
Telecom and media: monitoring across distance
The recurring theme in this group is distance, in two forms: physical distance to the equipment, and organizational distance between the monitoring team and whoever owns the system.
Deutsche Telekom IT keeps the internal network available for roughly 198,100 employees at more than 1,300 locations, in an active-active cluster where a failed node hands over on its own. Deutsche Telekom Security has a different problem: it sells several security products to different clients, and each client area must only ever see its own results. Satellites at customer sites answer the isolation question and the reachability question at once.
For the media and utility deployments, the equipment worth watching sits outside any data center. NTE monitors fiber infrastructure for Norwegian municipalities, schools, hospitals and banks, and has since added 60,000 IoT water meters to the same system. Clear Channel watches digital advertising panels in 17 European countries, where a black screen is lost revenue and a sensor reporting an open door or a rising temperature matters as much as a ping. RTLZWEI, a German free-to-air TV channel, moved a broadcast operation onto Azure and Kubernetes without changing monitoring tools.
GoldNet is the deployment furthest from a data center. The telecommunications provider watches around 150 radio transmission sites across regional Western Australia, most of them unmanned and some thousands of kilometers from the nearest technician, from two masters 600 kilometers apart so that losing one site does not mean losing visibility. Beyond routers, switches and firewalls it monitors solar collection, battery condition and energy consumption, because a flat battery bank at an unmanned desert site is a service outage in waiting. GoldNet came from Opsview, so its existing check plugins carried over with little rework. It is also the only deployment in this collection built around the native OpenTelemetry export: metrics leave Icinga over OTLP into a VictoriaMetrics cluster, which separates long-term storage from the monitoring UI.
“The OpenTelemetry work has been a big step for us. We’re no longer locked to a single visualisation tool, and having metrics in a dedicated time-series database gives us the flexibility to build dashboards around whatever operational question we’re trying to answer.”
Daniel Hooper, Technical Operations Manager, GoldNet Pty Ltd
Finance and insurance: Icinga monitoring under reporting obligations
In regulated industries the reporting obligation writes the requirement. At ING-DiBa, Germany’s largest direct bank, an impairment of a customer channel lasting more than four hours has to be reported to BaFin, the German financial regulator. That is why the team calls near-real-time monitoring essential rather than desirable, and why Icinga sits above every other monitoring source as the single view for the Service Control Room.
The other two deployments in this group are about migration under continuity constraints. Mutua Madrileña, one of Spain’s largest non-life insurers, replaced Nagios by running the old and the new system side by side until the new one was complete: no maintenance window, no gap in coverage. Worldline, a French payment processor active in more than 50 countries, has grown by acquisition, which means folding someone else’s monitoring stack into its own again and again. Director with CMDB integration is what makes that repeatable instead of a project each time.
Public sector and research: one Icinga platform, many stakeholders
Public sector IT has to serve departments that disagree about what they need. The City of Cologne replaced a set of heterogeneous tools with a single platform, then gave each of its ten departments its own permissions and its own view. The flexibility is what made consolidation acceptable internally, and the team reports that configuration work which used to take days now takes about an hour.
At the Leibniz Supercomputing Centre near Munich, monitoring reaches into the building itself: Icinga watches the hot-water cooling for the SuperMUC-NG supercomputer and can catch a failing pump before the machine overheats.
“Icinga’s built-in hierarchy is crucial, otherwise we would not be able to do monitoring.”
Dr. Markus Michael Müller, System Administrator, Leibniz Supercomputing Centre
The research and healthcare deployments in this group all arrived by replacing something. The Swiss Tropical and Public Health Institute in Basel treated a headquarters move as the occasion to rebuild monitoring from scratch rather than carry the old system across. The University of Bern’s Institute for Medical Education left Sensu v1 behind and now creates hosts and checks through the Director API, driven by Puppet and Ansible. University Hospital Ulm, an operator of critical infrastructure under German KRITIS rules, moved off Microsoft SCOM in 2019 because every new system meant manual setup and the alert volume contained a lot the team did not need.
Technology and IT services: monitoring as infrastructure and as a product
This is the largest group, and it splits into two patterns.
Umbrella monitoring for complex internal IT
DATEV runs one of the more complicated landscapes in Europe: IBM mainframes next to cloud-native microservices, spread across AWS, Azure and GCP, in a regulated financial and legal context. Rather than standardize the tooling, DATEV made Icinga the aggregation point that all the other monitoring tools report into, and generates its configuration from several CMDBs instead of the Director.
“We chose Icinga as our umbrella tool – and I honestly don’t think there are many solutions out there that can do this as well as Icinga.”
Konstantin Fanselow, System Engineer Monitoring, DATEV
Rohde & Schwarz took a different route and made Icinga part of a product. Its monitoring system for naval communications, border control and police infrastructure ships with Icinga inside, extended by in-house plugins that the company releases under GPL. Project lifecycles there run 15 years and longer, and replacing a certified component means recertification, which is exactly why an open-source base was the safer engineering choice.
Monitoring delivered as a service
Eight of these deployments are service providers, and their requirements converge on the same three things: keep clients isolated from each other, onboard quickly, prove the SLA. The answers differ. Telekom MMS, a Deutsche Telekom subsidiary, gives every enterprise client a completely separate Icinga instance, provisioned end to end by Ansible. SVA reduced onboarding to a single form that triggers the full stack deployment, and a new customer environment is monitored within hours. BTC IT Services, a German IT outsourcer, went in the opposite direction and consolidated what used to be one Nagios per client into a single platform where the CMDB decides what exists at all: if a server is not in the CMDB, it is not monitored.
The remaining five show how far the same model stretches. ACP IT Solutions has been running the same platform since 2015 and now reaches into more than 300 customer environments. RGK4IT places a satellite in each customer network over IPsec and finds that onboarding routinely surfaces problems the customer did not know they had. q.beyond monitors mid-sized German companies from the operating system up to SAP and IoT edge devices. Binero and Koofr, cloud providers in Sweden and Slovenia, both pass monitoring visibility on to their own customers rather than keeping it internal.
“Most of the time, when we onboard a customer, Icinga immediately shows problems they didn’t know about.”
Guilherme Carvalho, Infrastructure Analyst, RGK4IT
Retail and manufacturing: monitoring outside the data center
What connects this group is that the equipment worth watching is not in the data center, and often nobody is standing next to it. Müller monitors point-of-sale systems, printers, switches and cash drawers in 900 stores across seven countries, none of which has server infrastructure on site. The primary goal is not uptime reporting but giving the helpdesk something to look at when a store employee calls in a problem. Döhler covers more than 50 production sites with four people in the data center; many locations have no IT staff at all, so a fault has to be visible centrally before anyone local notices.
Where there is on-site production, the constraint is that it cannot stop. Photowatt, a French solar panel manufacturer in the EDF Group, runs a factory on a continuous three-shift schedule where any disruption halts production, and picked Icinga partly because the web interface let the whole team use it without Linux knowledge. Sun Chemical, one of the world’s largest manufacturers of printing inks, standardized Windows monitoring across a global estate with Apply Rules, then added a weekly script that compares Active Directory against the Icinga API to catch servers nobody registered. Magazine Luiza monitors one of Brazil’s largest retail and e-commerce operations and moved to Icinga for a lighter setup with more room for integrations.
Vimar, the Italian smart home and building automation manufacturer, is the clearest example here of a deliberate agentless approach: SNMP, WMI and passive checks rather than software installed on monitored devices. Jenkins pipelines call the Icinga API to register new virtual machines and manage downtimes as part of provisioning, which puts monitoring inside the deployment process instead of after it.
All 30 deployments at a glance
Telecom and media
| Organization | Use case | Key features |
|---|---|---|
| Deutsche Telekom IT Telecom |
Enterprise IT (16k hosts, 95k services, O365, AWS, Cisco Webex) | HA cluster, automation, Apply Rules, integrations |
| Deutsche Telekom Security Cybersecurity |
Managed security products, multi-client (64 satellites, 34 zones) | Multi-client isolation, distributed monitoring |
| NTE Telecom and energy |
ISP and renewable energy, IoT smart meters (6k hosts, 60k meters) | HA setup, Grafana dashboards, customer portal |
| Clear Channel Out-of-home advertising |
Digital panels in 17 countries (4,300 screens, 10k hosts) | HA setup, Apply Rules, parent-child dependencies |
| RTLZWEI Broadcasting |
Broadcast infrastructure across 3 data centers, Azure, Kubernetes | Automation, Tornado event processing, custom dashboards |
| GoldNet Telecom |
Microwave radio network for remote mining sites (500+ hosts, ~150 sites) | HA masters, Director, NetBox sync, OpenTelemetry |
Finance and insurance
| Organization | Use case | Key features |
|---|---|---|
| ING-DiBa Banking |
Direct banking IT, 800 applications (8k hosts, 100k services) | Umbrella monitoring, event DB, compliance reporting |
| Mutua Madrileña Insurance |
Insurance IT across data centers and cloud (1.2k hosts, 20k services) | Agentless SSH, Ansible, InfluxDB and Grafana |
| Worldline Payments |
Global payment network (7k devices, 60k services, 28 satellites) | Director and CMDB, Icinga DB, ServiceNow and PagerDuty |
Public sector and research
| Organization | Use case | Key features |
|---|---|---|
| City of Cologne Public administration |
Municipal IT for 10 departments (3.5k hosts, 45k services) | Director, Apply Rules, role-based access |
| Leibniz Supercomputing Centre Supercomputing |
SuperMUC-NG health and cooling (7.8k hosts, 76k services) | Hierarchical monitoring, 36 satellites, InfluxDB |
| Swiss TPH Public health research |
Research institute IT rebuilt from scratch (250 VMs, 38 labs) | Ansible and Director, vSphere, LibreNMS integration |
| University of Bern (IML) Higher education |
Campus and cloud IT after Sensu v1 replacement | Director API, Puppet and Ansible, custom dashboards |
| University Hospital Ulm Healthcare (KRITIS) |
Hospital IT, 29 clinics and 14 institutes (1.3k servers) | HA, Director and YAML config, vSphere DB module |
Technology and IT services
| Organization | Use case | Key features |
|---|---|---|
| DATEV Business software |
Mainframe to cloud-native, one umbrella (50,000+ server units) | Umbrella aggregation, chained satellites, CMDB automation |
| Rohde & Schwarz Electronics and defense |
Icinga inside a commercial product, ~300 projects worldwide | Custom GPL plugins, Icinga API, distributed monitoring |
| Telekom MMS IT services |
Isolated instance per client (35+ clusters, up to 2k servers each) | Director rollback, Ansible provisioning, multi-tenancy |
| SVA Systems integrator |
Multi-cloud managed services (2.3k hosts, 50k checks, 100 zones) | Director automation, Ansible and NetBox, SLA reporting |
| BTC IT Services IT services |
Consolidated from many Nagios instances (18.1k hosts, 123k services) | CMDB-driven config, Director, client satellites |
| ACP IT Solutions Managed services |
300+ customer environments from one platform (12k hosts, 130k services) | ~250 satellites, multi-tenancy, Puppet and Ansible |
| RGK4IT Managed services |
Monitoring-as-a-service for 1,700+ customers (1k+ hosts, 10k services) [Zahlen prüfen] | Satellite per customer, ITSM tickets, Icinga DB |
| q.beyond Managed services |
Cloud, SAP and IoT for SMEs (9k hosts, 63k services) | Multi-tenancy, Director automation, cluster distribution |
| Binero Cloud hosting |
OpenStack public cloud and customer environments | Icinga API, Puppet, CI/CD, customer dashboards |
| Koofr Cloud storage |
Privacy-oriented EU cloud storage, no data loss tolerance | Alert escalation (Slack, SMS), Grafana, Icinga DSL |
Retail and manufacturing
| Organization | Use case | Key features |
|---|---|---|
| Müller Retail |
900 stores in 7 countries (14k systems, 5k POS, 3-person team) | Satellite per country, Director, service sets, InfluxDB |
| Döhler Food and beverage |
50+ production sites, 75 offices, 4-person DC team (3.4k hosts) | Maps module, vSphere, Git-backed config |
| Photowatt Solar manufacturing |
24/7 factory IT accessible to the whole team | Icinga Web 2, NagVis maps, Grafana, Nagstamon |
| Sun Chemical Chemicals |
Global manufacturing IT, on-prem and Azure (3k hosts) | Apply Rules, Icinga API discovery, ServiceNow |
| Magazine Luiza E-commerce |
One of Brazil’s largest e-commerce operations (11k hosts, 43k services) | Satellite zones, Slack and Elastic integrations, NOC view |
| Vimar Building automation |
Reactive to proactive across mixed estate (750 hosts, 20k services) | Agentless (SNMP/WMI), API and Jenkins, Business Process module |
What this tells you about running Icinga at scale
Thirty documented deployments, five industries, a size range spanning two orders of magnitude, and those are only the organizations that agreed to publish. The architecture patterns repeat: masters in HA, satellites where the network or the tenant boundary requires them, configuration generated from a CMDB or an inventory system, metrics into a time-series database, alerts into the ticketing system that already exists.
What does not repeat is the shape of the environment. A bank reporting to BaFin, a hospital under KRITIS obligations, an MSP onboarding its 300th customer, and a radio network spanning the Western Australian outback have very little in common except that none of them fit a fixed monitoring model. Icinga is open-source, self-hosted, and configurable enough that the tool adapts to the environment rather than the other way around. No license per host, no feature tiers, no investors setting the roadmap. If you are evaluating monitoring for an environment at this scale, start with enterprise server monitoring or monitoring at scale. If you already run Icinga and want support behind it, the subscription options are on the pricing page.
Running something similar? We write up customer stories regularly, and you keep full review and approval. Get in touch!
FAQ
How many hosts can Icinga monitor?
The largest deployment documented here is DATEV, which monitors more than 50,000 server units. Others in this collection include ACP IT Solutions with 12,000 hosts and 130,000 services, BTC IT Services with 18,100 hosts and 123,000 services, and ING-DiBa with 8,000 hosts and 100,000 services. Scale is a function of architecture rather than team size: satellites are chained where the network or the tenant boundary requires them, and configuration is generated from a CMDB or an inventory system instead of written by hand.
Is Icinga used in enterprise and regulated environments?
Yes. ING-DiBa (Banking) uses Icinga in a context where an impairment of a customer channel lasting more than four hours must be reported to BaFin, the German financial regulator. University Hospital Ulm operates under German KRITIS critical infrastructure rules. Rohde & Schwarz ships Icinga inside a commercial monitoring product for naval communications, border control and police infrastructure, with project lifecycles of 15 years and longer.
Which industries use Icinga?
The 30 deployments in this article cover five sectors: telecom and media, finance and insurance, public sector and research, technology and IT services, and retail and manufacturing. The technology and IT services group is the largest, and eight of its deployments are service providers delivering monitoring to their own customers.
What do organizations replace when they move to Icinga?
Nagios is the most common predecessor: BTC IT Services consolidated one Nagios instance per client into a single platform, and Mutua Madrileña ran the old and the new system side by side until the migration was complete, with no maintenance window. Other documented migrations came from Microsoft SCOM at University Hospital Ulm, Sensu v1 at the University of Bern, and Opsview at GoldNet after it moved from open source to a commercial model. ACP IT Solutions evaluated PRTG and Checkmk before choosing Icinga, and RGK4IT evaluated Zabbix.