
When you work closely with Icinga Web 2, developing modules, building dashboards, poking around the internals, you naturally pick up on features that most users never think about. Some are usability...

Features in Icinga Web 2 Worth Knowing About
When you work closely with Icinga Web 2, developing modules, building dashboards, poking around the internals, you naturally pick up on features that most users never think about. Some are usability...
Monitoring Docker Containers with Icinga
A container reporting "up" tells you the process is running, not that the workload is healthy - but that caveat is true of any service, on a container or a bare server. What makes containers their own monitoring problem is the layer around the process: per-container...

Icinga 2 Meets OpenTelemetry: Native Metrics Export in v2.16
The OTLPMetricsWriter is a new Icinga 2 feature available since v2.16 that exports check plugin performance data as OpenTelemetry-compliant metrics via the OTLP HTTP protocol. With a single configuration object, it connects Icinga 2 to any OTLP-compatible backend like...
Icinga 2 Insights With Event Streams
There are many ways to interact with the data that Icinga 2 collects, processes, and produces. The most common is probably Icinga Web, which displays checks in all the colors of a traffic light. Icinga 2 also comes with several metrics or performance data writers. But...
Turns any command into a plugin: check_rungrep
Imagine you have one more special thing to monitor. While our Icinga 2 can observe infrastructure of almost any size, it still needs a plugin for each kind of check. Unfortunately not every command meets the monitoring plugin API: exit code 0-3 (ok, warning, critical,...
How to do Agentless Monitoring with check_by_ssh
The fundamentals of Icinga 2 are check plugins. They are being executed and their return value is mapped to either Host or Service objects. Everything else follows on top. These check plugins can be either from the Monitoring Plugins or custom. While their origin does...

Common cloud monitoring challenges we can overcome!
In today's fast-paced digital landscape, businesses are moving their operations to the cloud more than ever before. This shift brings incredible benefits like scalability, flexibility, and cost-efficiency. While it does introduce various common cloud monitoring...
Monitoring the Monitoring: Demystifying the Icinga DB Health Check
In this post we will take a look at the icingadb check command built into Icinga 2 for monitoring the health of Icinga DB. If you have already configured it, this blog post will give you some insights on what it actually checks, otherwise, it showcases what useful...

Icinga Notifications – How to Set Up Desktop Alerts
We recently released the beta version of our Notification Web Module, which includes a cool feature that is not yet known to everyone. We named it Desktop Notifications (Browser Push Notifications). With this feature enabled, your browser can send you instant...

Monitoring domains and DNSSEC properly
First of all, if you own a domain, the following text is for you. In production you obviously want to reduce outages. And an outage of a DNS domain as such takes down all services under that domain, no matter whether your LAMP components are all up and running. At...

Infrastructure Monitoring Checklist: What you should monitor
You want to monitor your infrastructure? Monitoring is essential to ensure system stability, security and optimal performance. Without proper monitoring, small issues can quickly escalate into major problems and affect productivity and service availability. While...
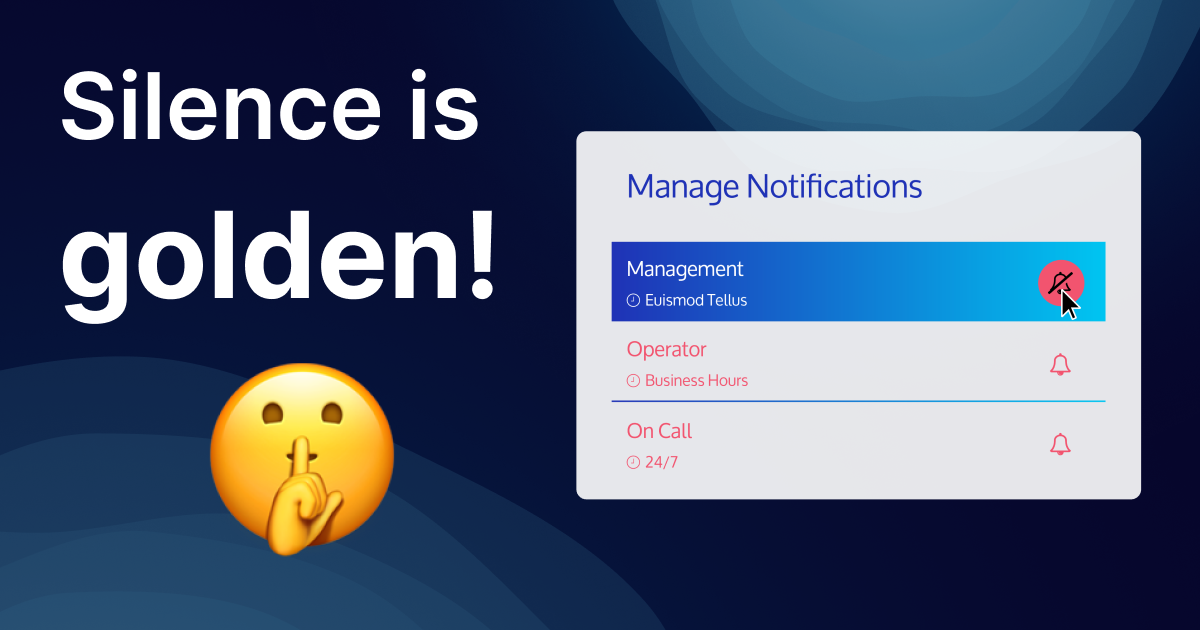
Icinga Notifications: Incident muting
In a previous article, Julian provided a comprehensive overview of the characteristics and functionality of Incidents in Icinga Notifications. In today's blog, I will explain the concept of Incident muting and its underlying mechanisms. What is Incident Muting? The...

Subscribe to our Newsletter
A monthly digest of the latest Icinga news, releases, articles and community topics.