When you work closely with Icinga Web 2, developing modules, building dashboards, poking around the internals, you naturally pick up on features that most users never think about. Some are usability...

Features in Icinga Web 2 Worth Knowing About
When you work closely with Icinga Web 2, developing modules, building dashboards, poking around the internals, you naturally pick up on features that most users never think about. Some are usability...
Icinga Web v2.13 and IPL: PHP 8.5 Support & Module Updates Release
This is not just a version bump. Raising the PHP floor allowed us to modernize the IPL codebase in ways that were not possible before: strict type declarations throughout, and a cleaner, more predictable API surface. We are also introducing two new packages:...
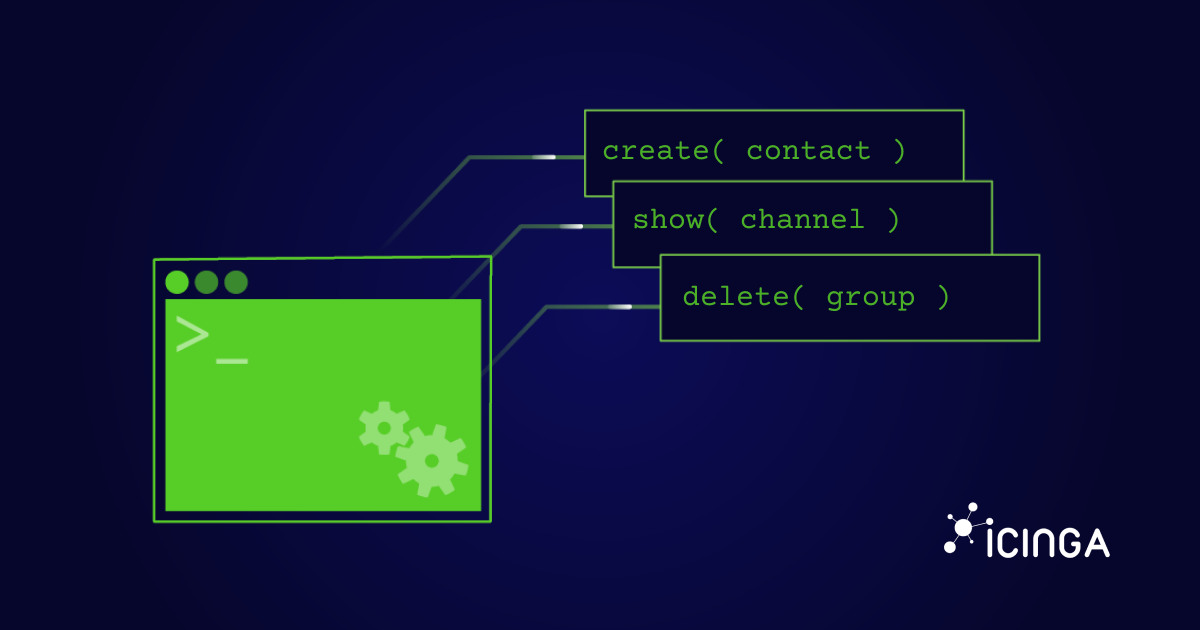
Sync Your Users Into Icinga Notifications: Introducing the Contacts/Groups API
If you’ve ever onboarded a teammate at 4:57 PM on a Friday (or offboarded one at 4:58 PM… ), you know the pain: keeping notification contacts and groups up to date is work. With the Icinga Notifications REST API, you can automate that and avoid drift. That’s why I’m...
What is SNMP Trap: Real-Time Alerts for Network Monitoring
Why wait for the next poll? An SNMP trap is a real-time alert sent from a device to a monitoring system, without waiting for polling. Ever had a router die silently at 3 AM while your monitoring system was still polling away every 5 minutes? Yeah… not fun. That’s...
Observability vs Monitoring: Enhancing, Not Replacing
In the dynamic world of IT operations, a common misconception has emerged: Observability vs Monitoring is often framed as a battle where one replaces the other. At Icinga, where open-source monitoring is our expertise, we aim to clarify this misunderstanding....

Common cloud monitoring challenges we can overcome!
In today's fast-paced digital landscape, businesses are moving their operations to the cloud more than ever before. This shift brings incredible benefits like scalability, flexibility, and cost-efficiency. While it does introduce various common cloud monitoring...
Announcing Icinga for Kubernetes v0.2.0
We are excited to announce the release of Icinga for Kubernetes v0.2.0! This update brings a host of new features and improvements that enhance our monitoring solution for Kubernetes. It makes it easier than ever to analyze problems and understand complex Kubernetes...
What a Cloud Monitoring Architecture looks like
In today's fast-paced, digitally-driven business world, cloud computing has become the foundation of scalable and flexible IT infrastructure. As organizations transition to the cloud to gain agility, scalability, and cost savings, it becomes crucial to monitor cloud...

Chart.js: Visualizing Data for Better Insights
In the field of data visualization, Chart.js is a popular JavaScript library used to make flexible and good-looking charts. It's simple and versatile, making it a great choice for many uses, including monitoring systems. This library ensures that charts display well...

Unleashing the Potential of SVGs: A Guide to Dynamic Visualization and Monitoring
Introduction In the dynamic realm of monitoring Kubernetes clusters, effective visualization is paramount for gaining insights into system health and performance. One versatile tool that has gained prominence in this domain is Scalable Vector Graphics (SVGs). In this...

Local Kubernetes-Cluster with Minikube
Hello there! I'm currently a trainee at Icinga, and I'm excited to share my experiences with you regarding our fascinating project involving the integration of Kubernetes into Icinga's monitoring infrastructure. To make this task more manageable and efficient, we've...

Subscribe to our Newsletter
A monthly digest of the latest Icinga news, releases, articles and community topics.
