When you work closely with Icinga Web 2, developing modules, building dashboards, poking around the internals, you naturally pick up on features that most users never think about. Some are usability...

Features in Icinga Web 2 Worth Knowing About
When you work closely with Icinga Web 2, developing modules, building dashboards, poking around the internals, you naturally pick up on features that most users never think about. Some are usability...
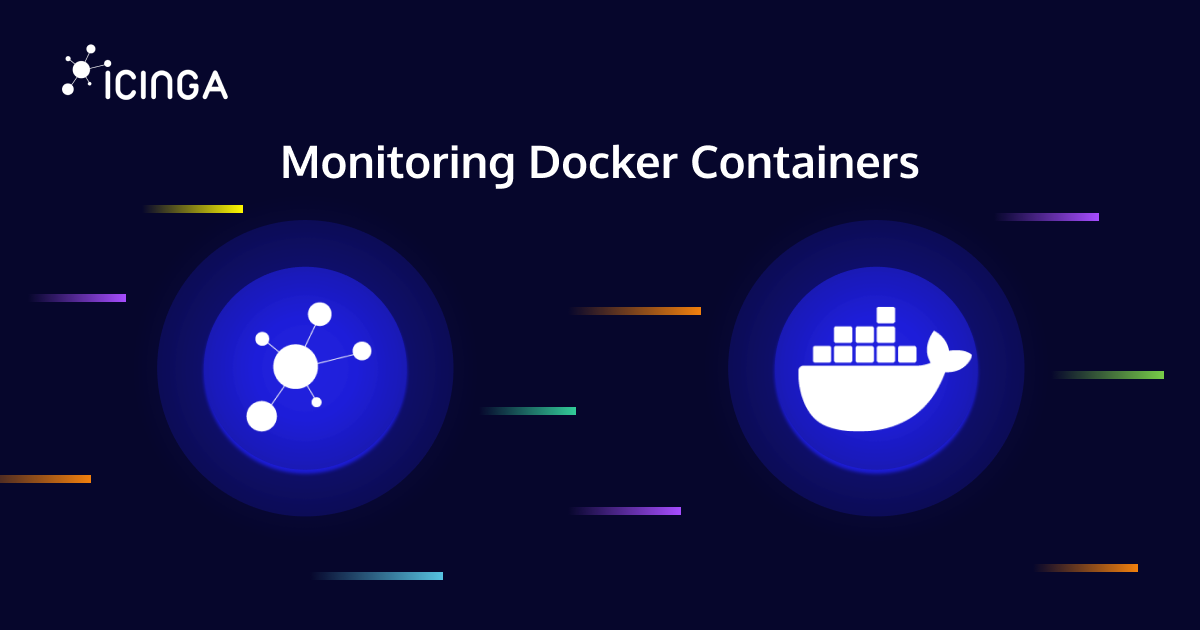
Monitoring Docker Containers with Icinga
A container reporting "up" tells you the process is running, not that the workload is healthy - but that caveat is true of any service, on a container or a bare server. What makes containers their own monitoring problem is the layer around the process: per-container...

Icinga 2 Meets OpenTelemetry: Native Metrics Export in v2.16
The OTLPMetricsWriter is a new Icinga 2 feature available since v2.16 that exports check plugin performance data as OpenTelemetry-compliant metrics via the OTLP HTTP protocol. With a single configuration object, it connects Icinga 2 to any OTLP-compatible backend like...

Icinga as Open-Source MSP Monitoring Software: Multi-Tenant Monitoring for IT Service Providers
Icinga is an open-source MSP monitoring software used by managed service providers to monitor multi-tenant client environments at scale. It covers the infrastructure layer that RMM tools don't reach: network devices, custom service checks, SLA reporting, and deep...
Releasing Icinga for Windows v1.14.0 – We have been cooking!
As Bernd mentioned at last year's OSMC, the Icinga for Windows team was heavy working on v1.14.0 which was going to be released in December. Well, we are off a couple of days, but we believe the wait was worth it! Security Update Let's first get the elephant...

Monitor One Icinga 2 Cluster From Another
Icinga is designed to be a highly dynamic monitoring software that can monitor your setup, regardless of its architecture. While most setups are hierarchical and fit well into the master, satellites, and agents scheme with different zones, it is sometimes impractical...

Drowning in Alert Fatigue? How to Regain Control of Your Monitoring
Introduction: Why Alert Fatigue Hits Sysadmins Sooner or Later If you’ve ever muted your phone during a maintenance window, only to miss a real outage an hour later, you’re not alone. Sysadmins on Reddit and beyond often describe feeling like they’re drowning in...

Using Icinga 2 on NixOS
I use NixOS by the way. And today I'm going to show you how to operate a simple Icinga setup using that operating system. I.e. a single node with checks and notifications. In contrast to Icinga Web 2 or Redis, NixOS provides an Icinga 2 package, but no module....
Nagios Alternatives: Why Icinga Is the Strongest Choice
Introduction Nagios has long been a trusted name in IT monitoring. Its plugin-based architecture and long-standing community have made it a stable choice for organizations of all sizes. However, IT infrastructures have changed dramatically in the last decade. With...
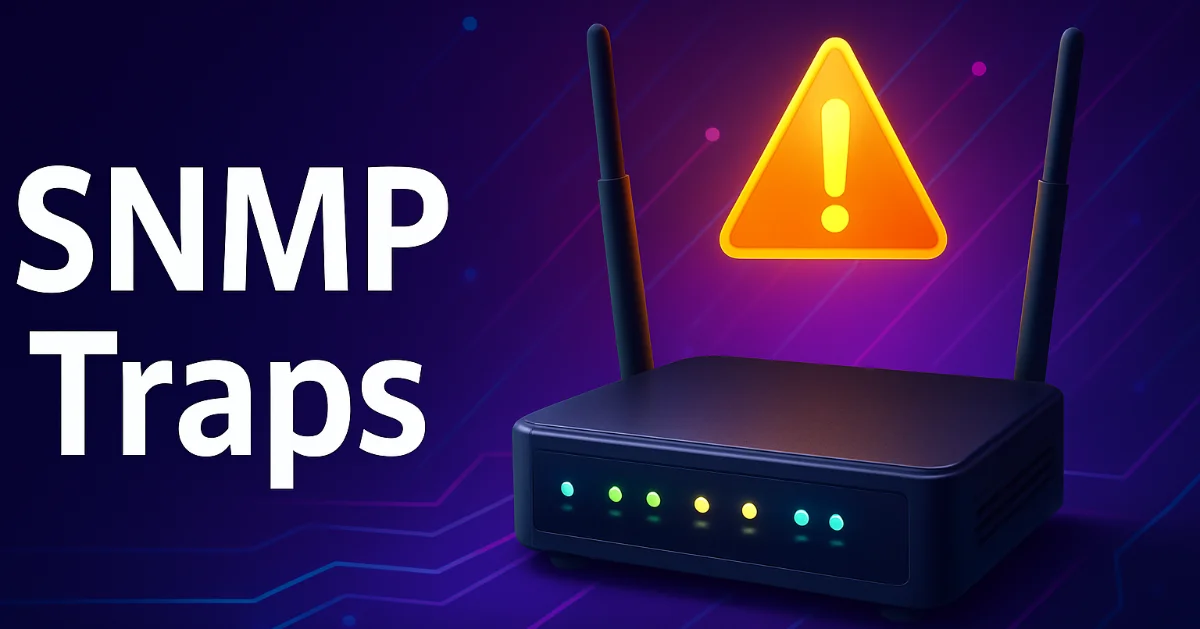
What is SNMP Trap: Real-Time Alerts for Network Monitoring
Why wait for the next poll? An SNMP trap is a real-time alert sent from a device to a monitoring system, without waiting for polling. Ever had a router die silently at 3 AM while your monitoring system was still polling away every 5 minutes? Yeah… not fun. That’s...
Upgrade your monitoring lists with icon images
Recently I was importing an Icinga configuration for testing purposes. Working with this configuration, I found that there were icon images assigned to the objects. Sadly, those didn’t display, because I didn’t have the icon set installed. So I thought of creating my...
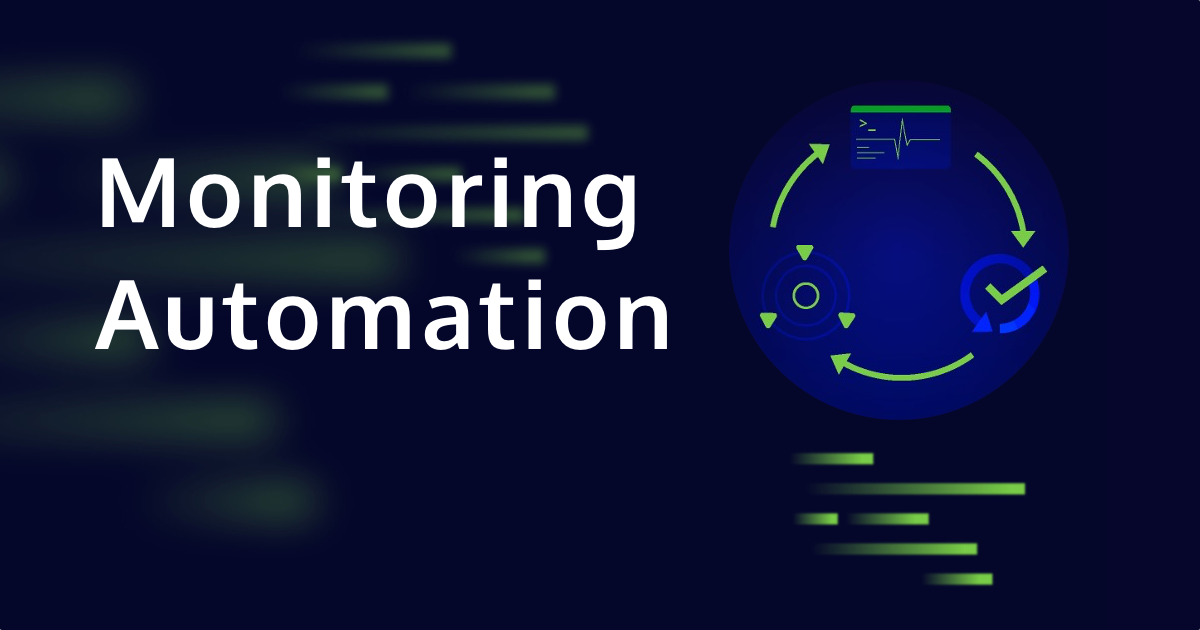
Icinga DB Web Automation
Icinga DB Web Automation allows you to automate monitoring tasks and integrate them directly into your systems and workflows. It is possible to issue command actions without a browser. To do so, a form needs to be submitted by a tool such as cUrl. Every request you...

Subscribe to our Newsletter
A monthly digest of the latest Icinga news, releases, articles and community topics.
