
When you work closely with Icinga Web 2, developing modules, building dashboards, poking around the internals, you naturally pick up on features that most users never think about. Some are usability...

Features in Icinga Web 2 Worth Knowing About
When you work closely with Icinga Web 2, developing modules, building dashboards, poking around the internals, you naturally pick up on features that most users never think about. Some are usability...
Monitoring Docker Containers with Icinga
A container reporting "up" tells you the process is running, not that the workload is healthy - but that caveat is true of any service, on a container or a bare server. What makes containers their own monitoring problem is the layer around the process: per-container...

IPL: How to use the ipl-web TermInput
Most form fields ask users for a single value like a name, an email, or a date. But some need a list of values. A plain text input with comma-separated values can technically do the job, but it gives no feedback while typing, no suggestions, and one invalid entry...
How to check CPU usage on Linux
When your Linux system feels sluggish, one of the first things to investigate is the CPU usage. The CPU (Central Processing Unit) is the brain of your machine, and if it’s overloaded, everything else slows down. In this guide, you’ll learn different ways to Linux...
Upgrade your monitoring lists with icon images
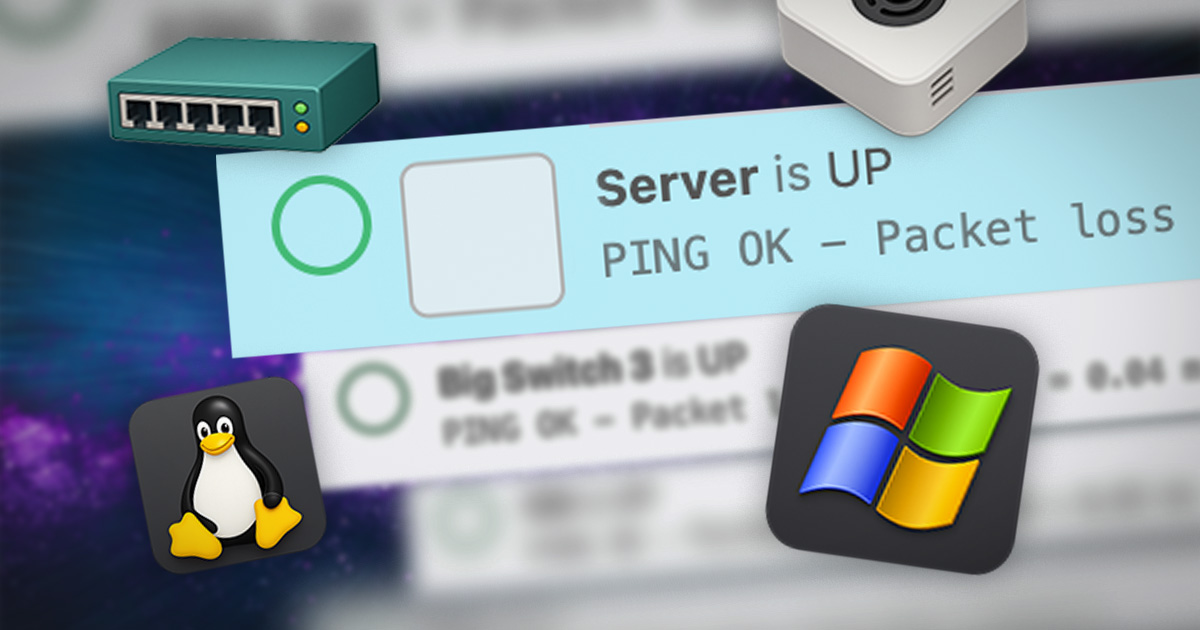
Recently I was importing an Icinga configuration for testing purposes. Working with this configuration, I found that there were icon images assigned to the objects. Sadly, those didn’t display, because I didn’t have the icon set installed. So I thought of creating my...
Targeting hosts and services in Icinga 2 API requests
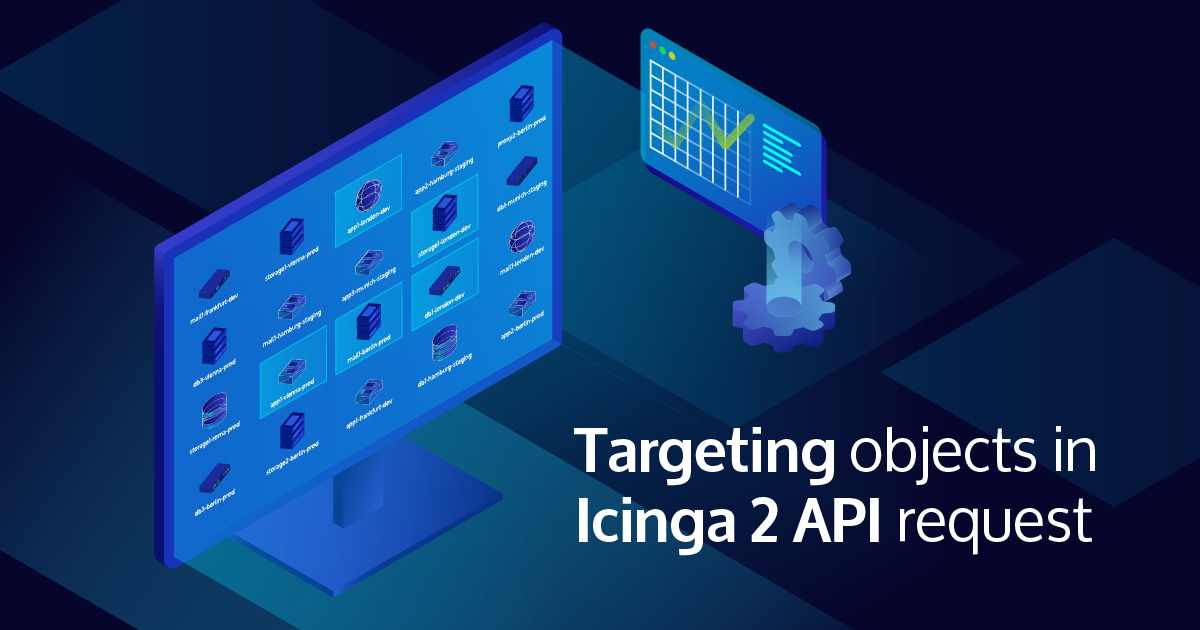
Today, we are going to take a look at the Icinga 2 API and the various ways targets can be specified for different actions, such as querying information or scheduling downtimes. This post focuses on the API request payloads themselves and assumes some familiarity with...
Extending Unit-Testing on Icinga2
Unit-Testing is important Obviously nobody is disagreeing with this. It's just that during ongoing development and while focusing on features and bug-fixes, testing often falls behind in priority, especially when developers would need to write tests for existing or...
Icinga DB Web Automation
Icinga DB Web Automation allows you to automate monitoring tasks and integrate them directly into your systems and workflows. It is possible to issue command actions without a browser. To do so, a form needs to be submitted by a tool such as cUrl. Every request you...
Endpoint Monitoring with Icinga
Monitoring with Icinga primarily focuses on servers and infrastructure. But there are also the people operating these systems from their workstations and laptops. If a server can be accessed from a machine with an outdated operating system, the patch level of the...
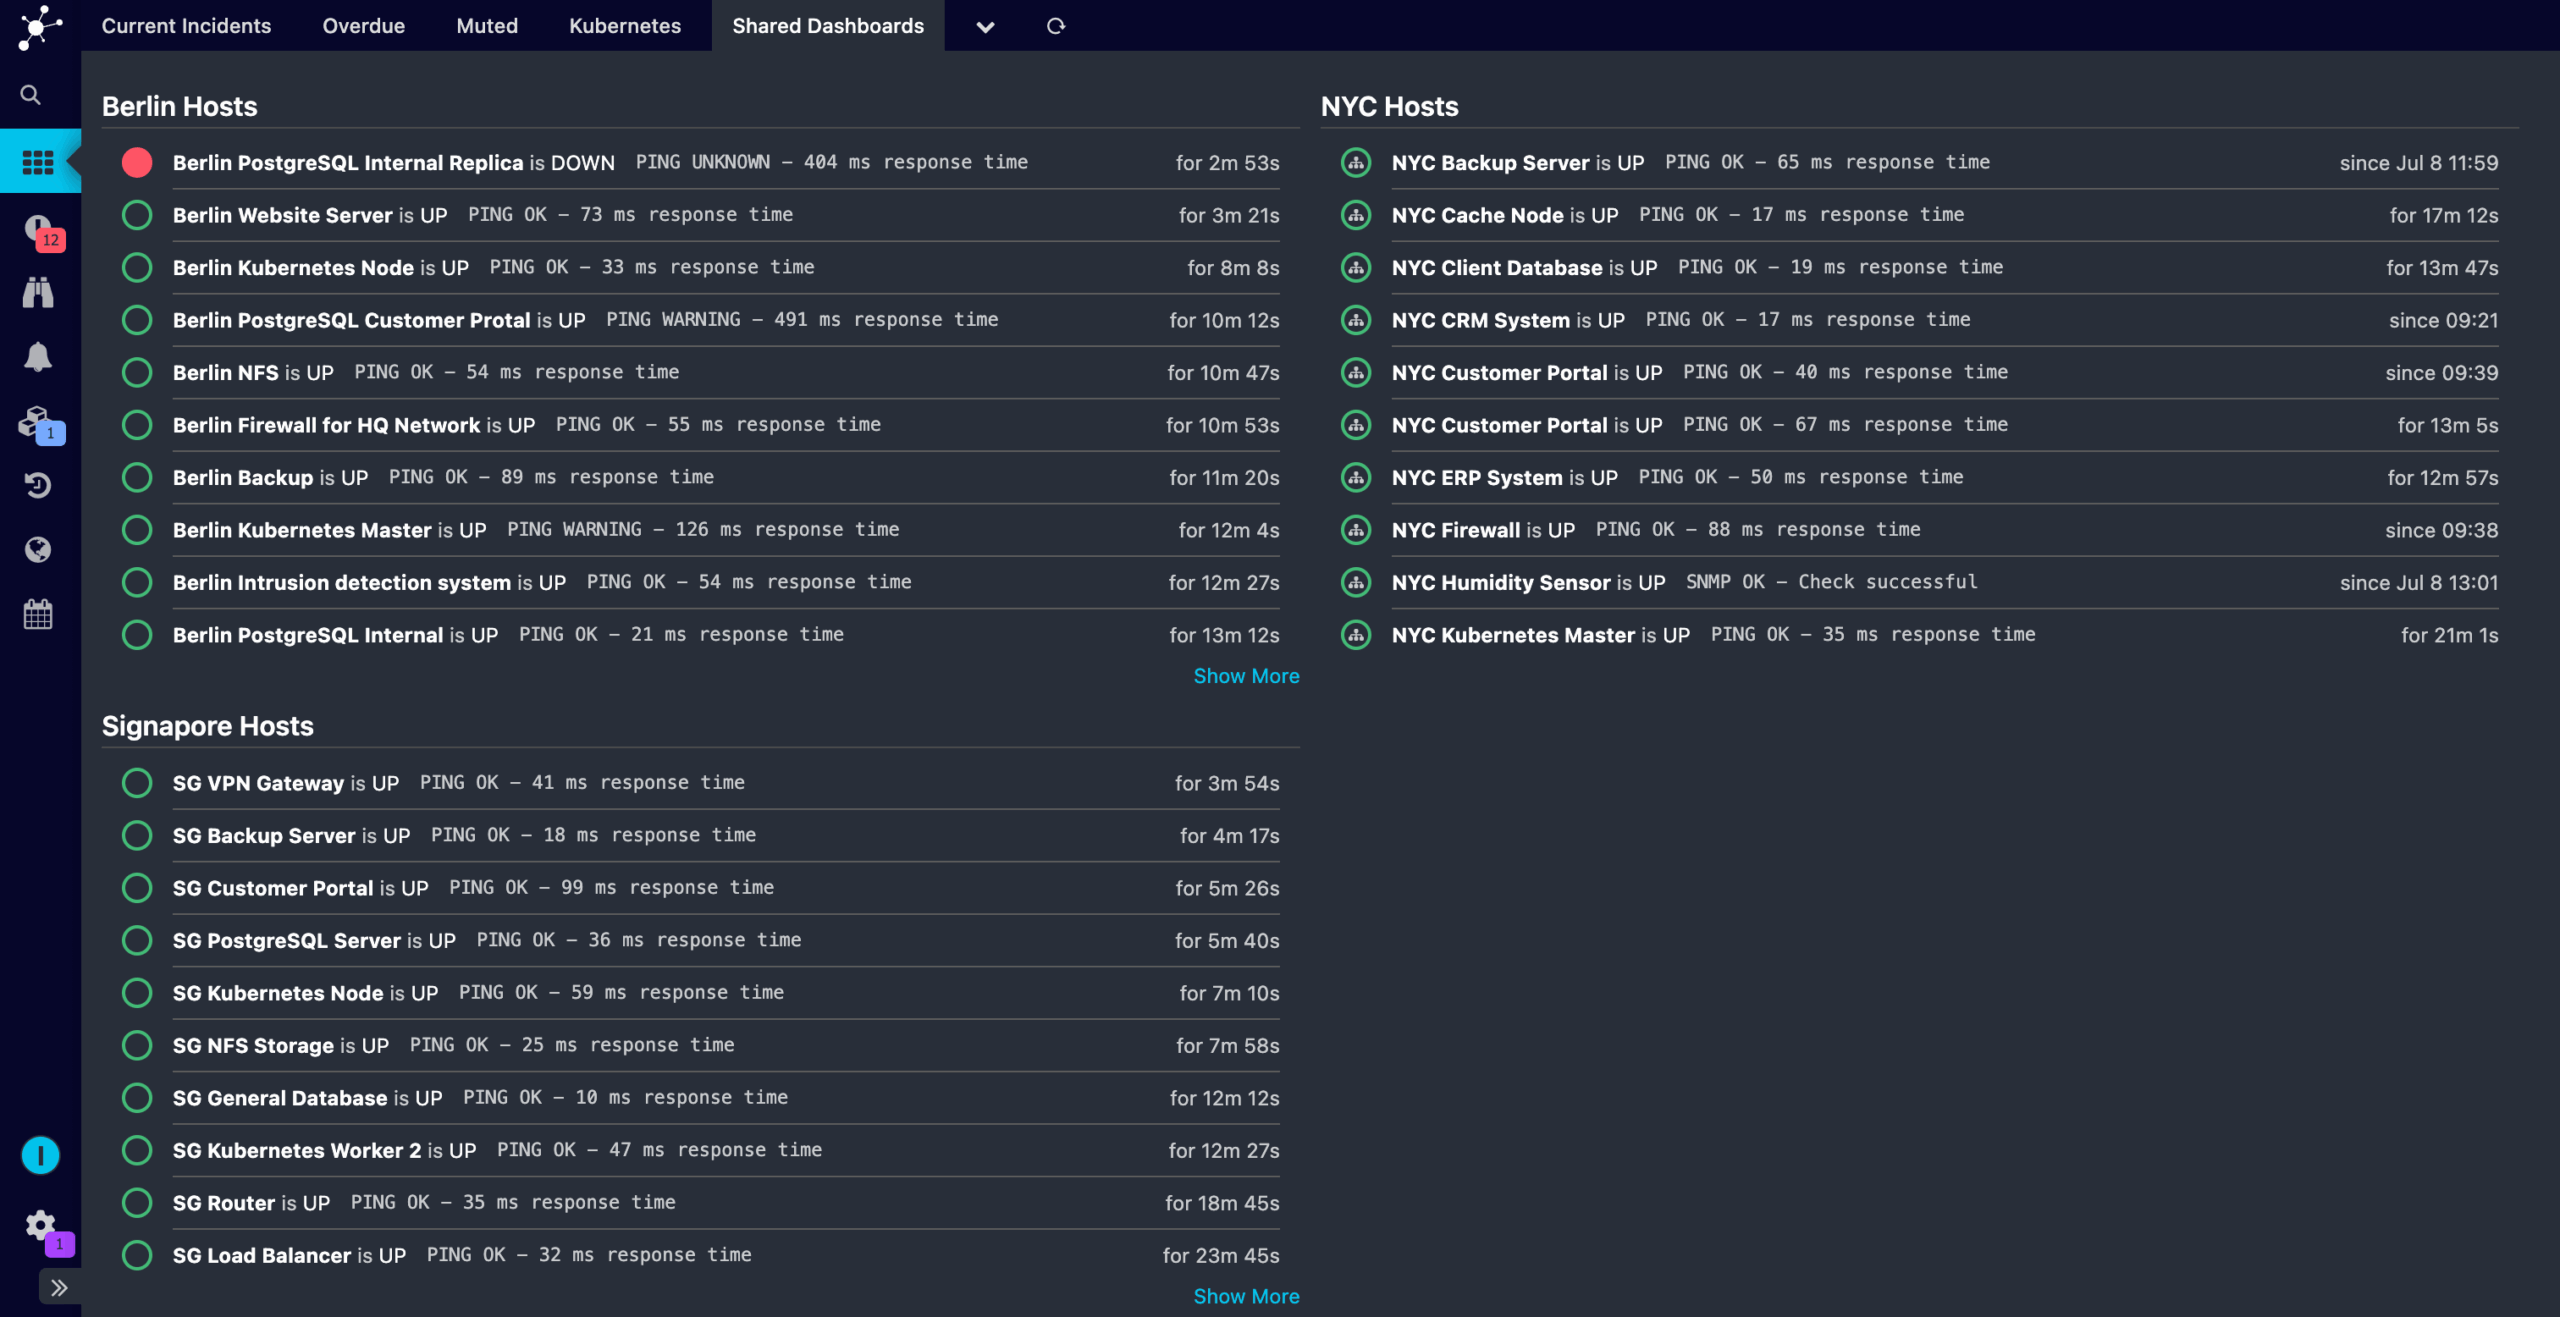
Dashboard Sharing – The Hard Way
Current Limitation: Dashboard Sharing Not Yet Supported Unlike menu items, dashboards in Icinga Web 2 currently can't be shared across users. This is something we will implement in future versions, but for now users can only create dashboards for themselves. We don't...

IPL: How to create lists with ipl-web
In my previous blog post, I explained how to build lists using ipl-web widgets. That method will soon be deprecated due to its complexity. With the recent ipl-web release, we have introduced a simpler and more flexible approach to building lists, using a lightweight...
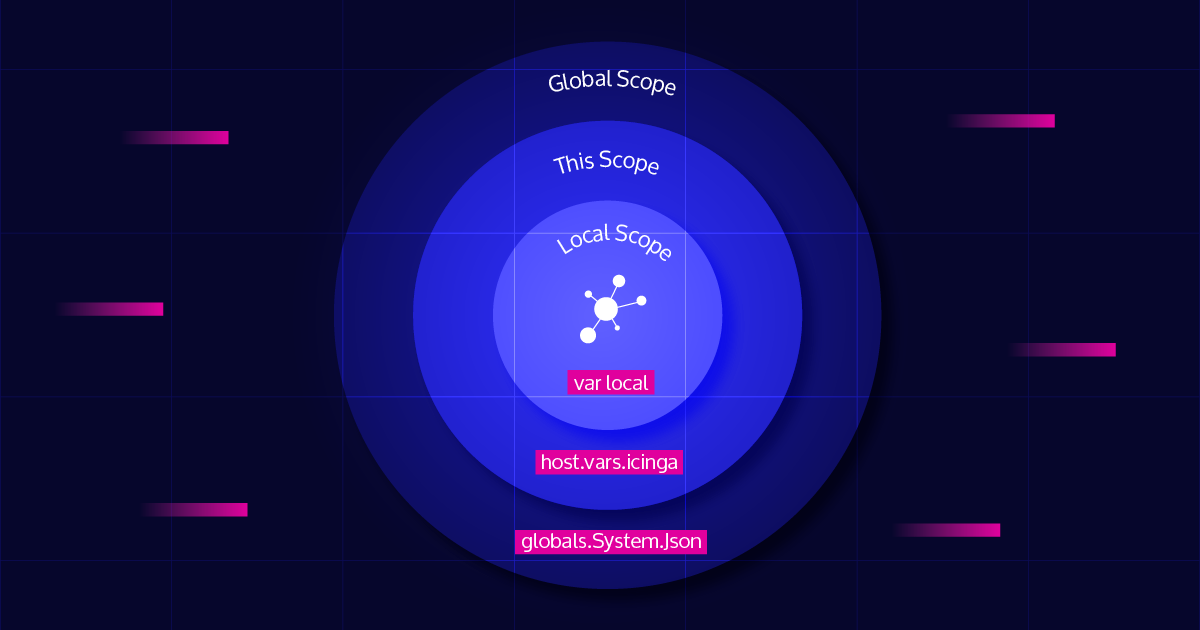
Icinga 2 DSL – Variable Scopes
Ever wondered how Icinga 2 manages all those variables, and how it knows which one to use? In this blog post, we will explore all the different variable scopes in Icinga 2, and by the end, you will know what this mysterious error message means when you see it in your...

Subscribe to our Newsletter
A monthly digest of the latest Icinga news, releases, articles and community topics.