A container reporting "up" tells you the process is running, not that the workload is healthy - but that caveat is true of any service, on a container or a bare server. What makes containers their...
Monitoring Docker Containers with Icinga
A container reporting "up" tells you the process is running, not that the workload is healthy - but that caveat is true of any service, on a container or a bare server. What makes containers their...

Icinga 2 Meets OpenTelemetry: Native Metrics Export in v2.16
The OTLPMetricsWriter is a new Icinga 2 feature available since v2.16 that exports check plugin performance data as OpenTelemetry-compliant metrics via the OTLP HTTP protocol. With a single configuration object, it connects Icinga 2 to any OTLP-compatible backend like...

Icinga as Open-Source MSP Monitoring Software: Multi-Tenant Monitoring for IT Service Providers
Icinga is an open-source MSP monitoring software used by managed service providers to monitor multi-tenant client environments at scale. It covers the infrastructure layer that RMM tools don't reach: network devices, custom service checks, SLA reporting, and deep...
Endpoint Monitoring with Icinga
Monitoring with Icinga primarily focuses on servers and infrastructure. But there are also the people operating these systems from their workstations and laptops. If a server can be accessed from a machine with an outdated operating system, the patch level of the...

Hybrid IT Infrastructure Management
Introduction Today’s IT environments are rarely confined to a single data center or a single cloud provider. Enterprises are embracing a mix of cloud platforms, virtual machines, and on-premises hardware to stay agile and competitive. This blended environment is known...

Announcing Icinga for Kubernetes v0.3.0
We’re excited to share that Icinga for Kubernetes v0.3.0 is here! This release is packed with features designed to make monitoring your Kubernetes environments smoother, smarter, and more efficient. Let’s take a closer look at what’s new: Monitor Multiple...
Observability vs Monitoring: Enhancing, Not Replacing
In the dynamic world of IT operations, a common misconception has emerged: Observability vs Monitoring is often framed as a battle where one replaces the other. At Icinga, where open-source monitoring is our expertise, we aim to clarify this misunderstanding....

Investment Trends in Infrastructure Monitoring Market: What Users Should Know
In recent months, the IT monitoring landscape has seen notable investment activity: Turn/River Capital acquired SolarWinds. The same firm previously invested in Paessler (PRTG). Checkmk announced a strategic investment from PSG. These developments are part of a larger...

How To Pick The Correct Metrics For Your Monitoring
This is a guest blogpost by Adam Sweet from the Icinga Partner Transitiv Technologies. Since this is a longer post, we added a tl;dr at the end. For many, host and application monitoring is an afterthought at the end of a project. Some people don’t think about...

Monitor Microservices Effectively: A Practical Guide
Contents What Is Microservice Monitoring? Why Monitoring Microservices Is Different – and What It Means for You Key Metrics and Signals You Should Track Best Practices for Monitoring Microservices Monitoring Tools for Microservices: What to Look For Microservice...

Icinga 2 Insights With Event Streams
There are many ways to interact with the data that Icinga 2 collects, processes, and produces. The most common is probably Icinga Web, which displays checks in all the colors of a traffic light. Icinga 2 also comes with several metrics or performance data writers. But...
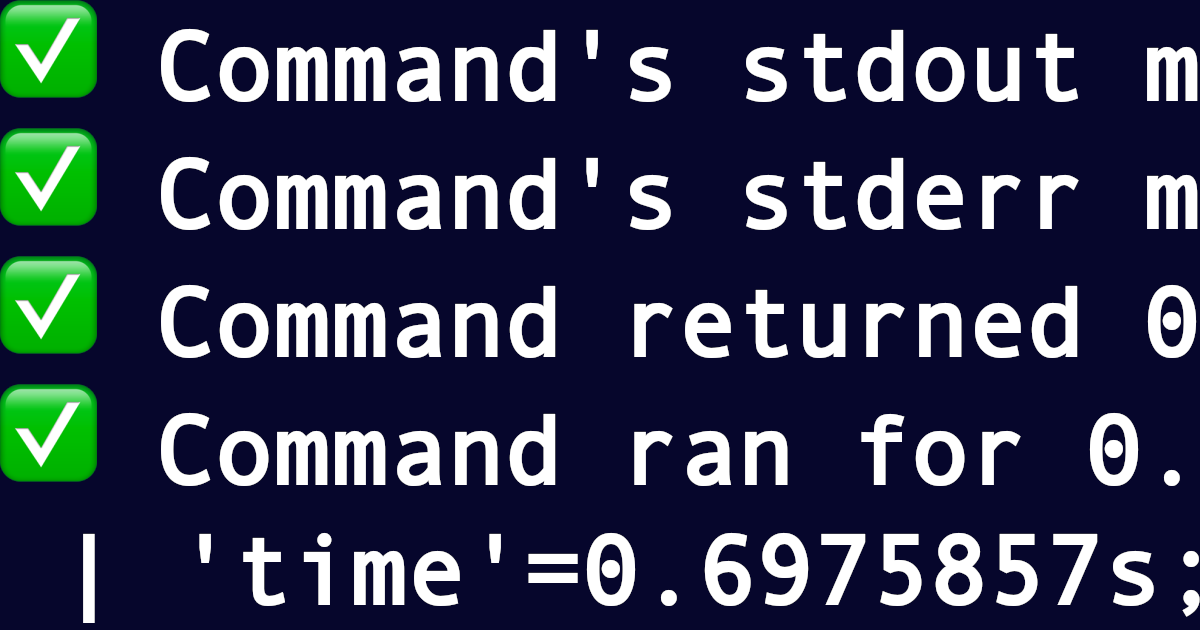
Turns any command into a plugin: check_rungrep
Imagine you have one more special thing to monitor. While our Icinga 2 can observe infrastructure of almost any size, it still needs a plugin for each kind of check. Unfortunately not every command meets the monitoring plugin API: exit code 0-3 (ok, warning, critical,...

Subscribe to our Newsletter
A monthly digest of the latest Icinga news, releases, articles and community topics.
