
A Fresh Take on Form Element Decorators Decorators have always been a powerful concept in Icinga Web’s form system — letting developers control how form elements are displayed without hardcoding...

Ipl-html: Introducing new Form Element Decorators
A Fresh Take on Form Element Decorators Decorators have always been a powerful concept in Icinga Web’s form system — letting developers control how form elements are displayed without hardcoding...
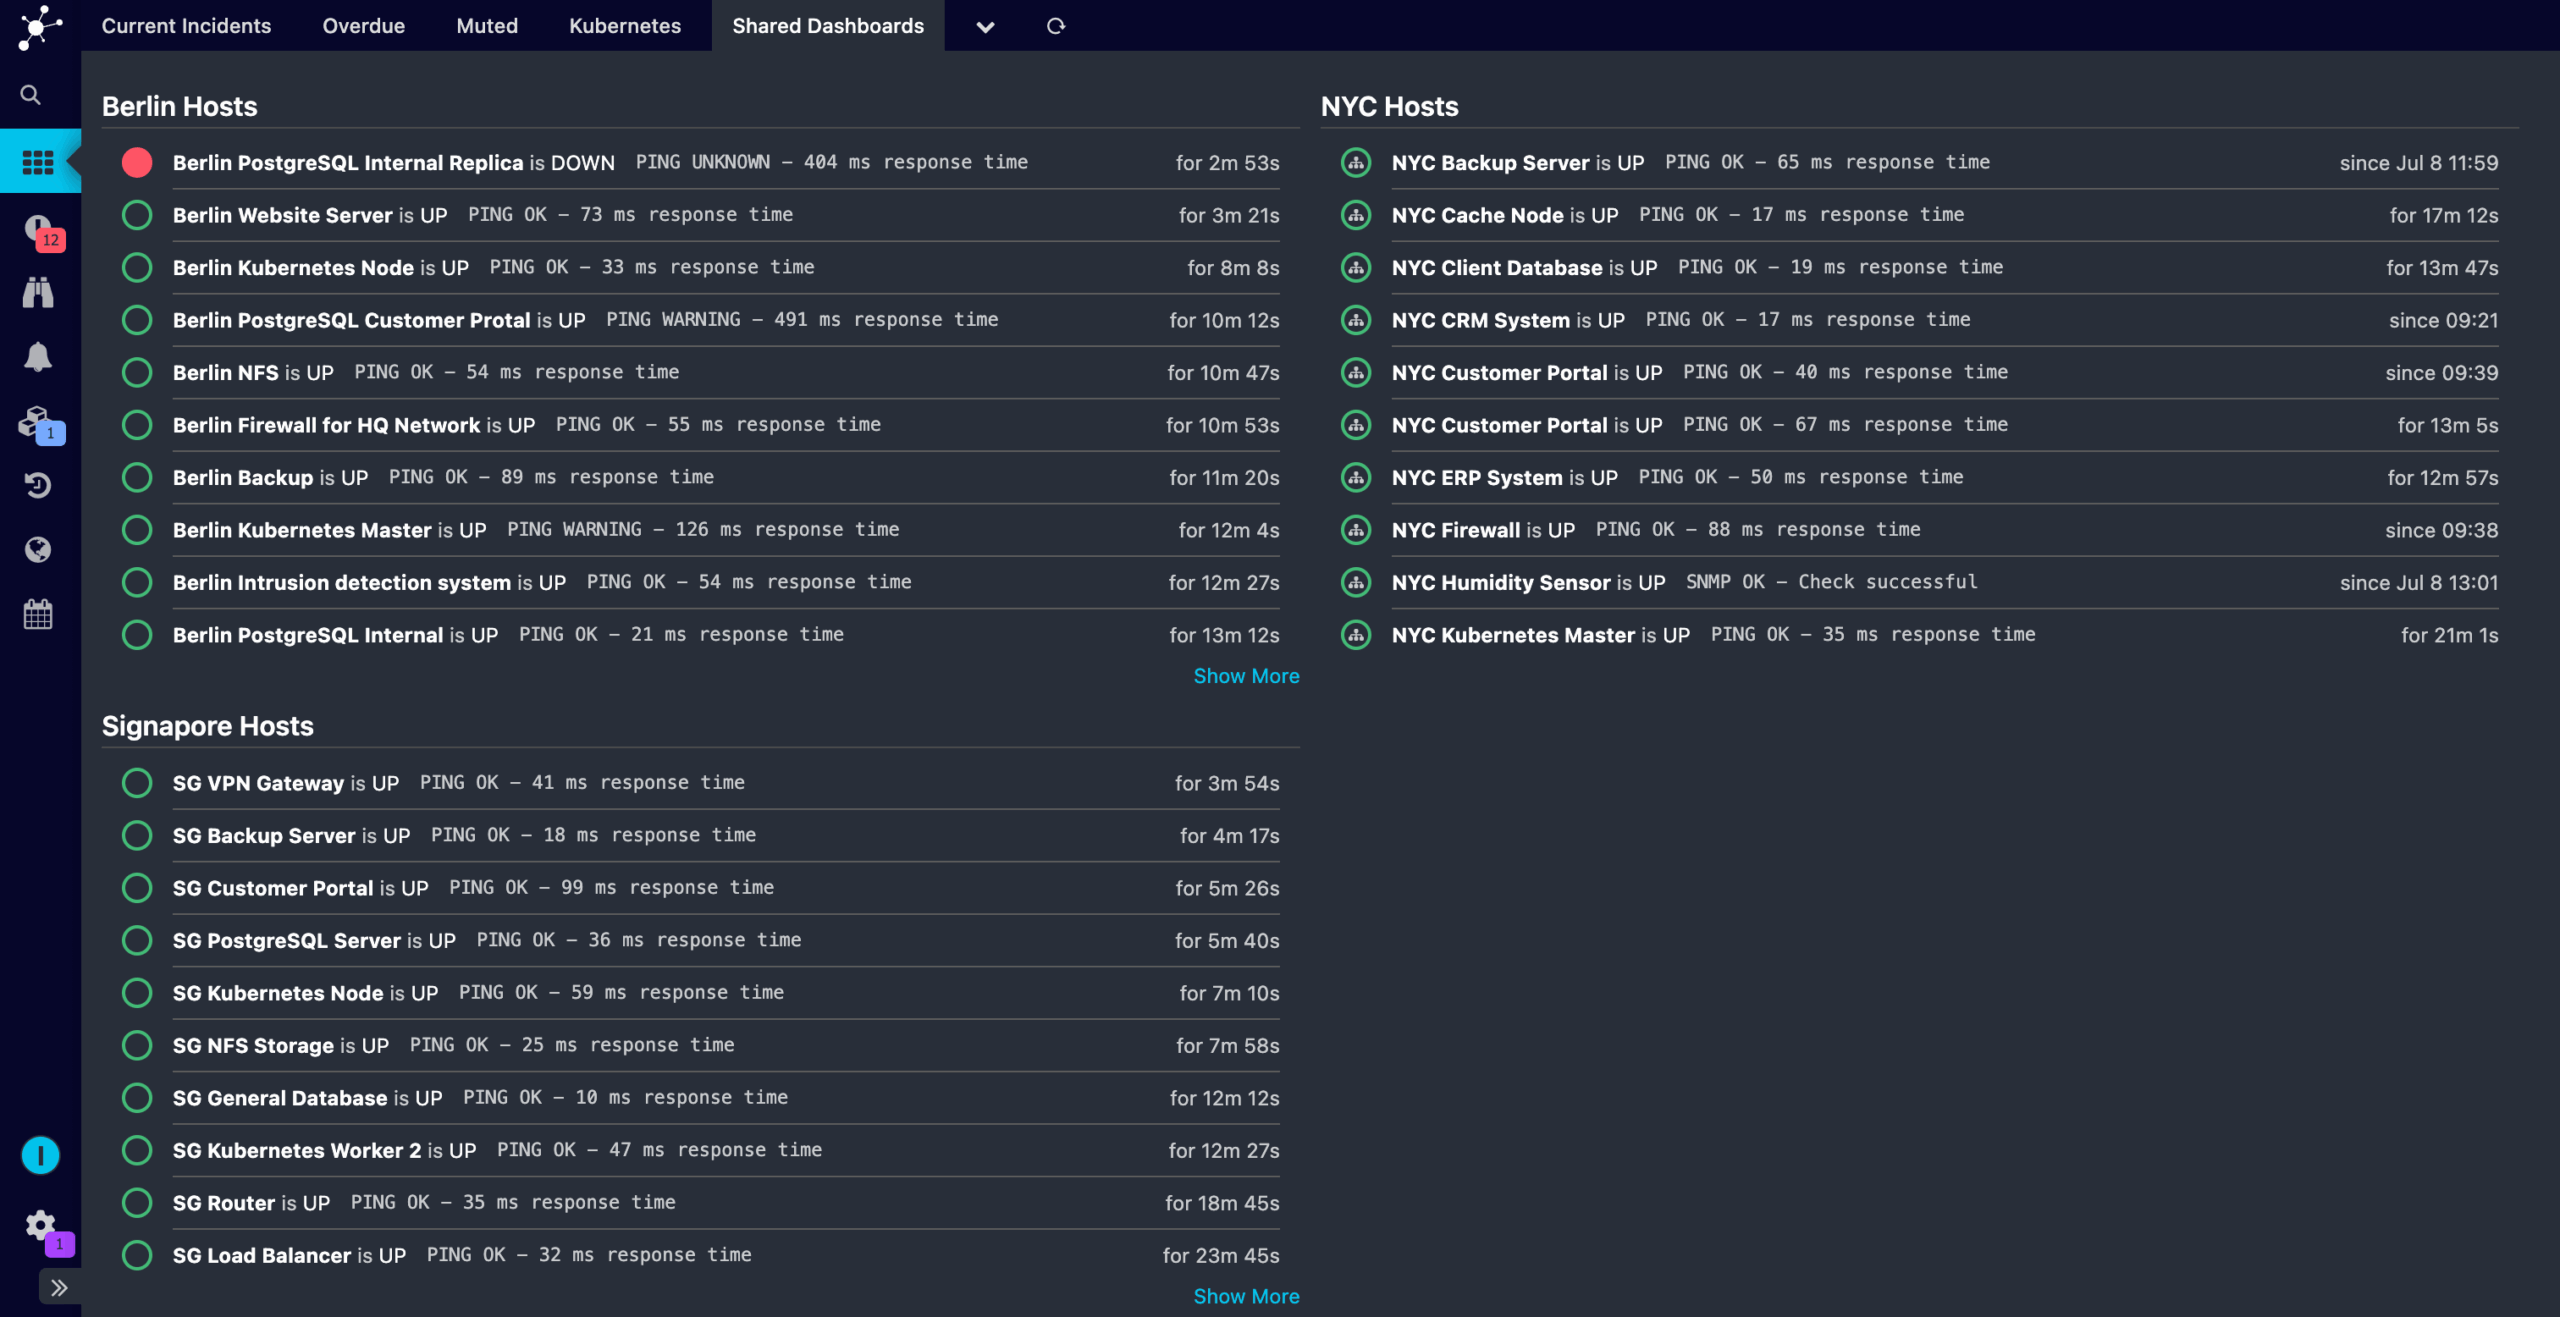
Dashboard Sharing – The Hard Way
Current Limitation: Dashboard Sharing Not Yet Supported Unlike menu items, dashboards in Icinga Web 2 currently can't be shared across users. This is something we will implement in future versions, but for now users can only create dashboards for themselves. We don't...
A little love for two old fellas – Icinga Business Process Modeling and Icinga Web Graphite Integration
Today is the day, we grant two products their long overdue maintenance. Maintenance always sounds boring, I hear you. But let me remind you that this also means we do and take care! And what this actually is all about: Icinga Business Process Modeling v2.5.2 Icinga...
Releasing Icinga vSphere® Integration v1.6
We're happy to announce our first release of the year! Version 1.6 of the Icinga vSphere® Integration is out now and waiting to get installed on your Icinga monitoring environment. This release brings performance improvements, ships new metrics to InfluxDB and some...

Icinga DB Web Search Bar – Features & How It Works
With Icinga DB Web you can filter the list views in a very elegant and lovely manner. If you haven't tried this search bar yet, it's time to begin now. Unlike in the monitoring module, where you have to tediously filter the views based on clicking through all the...
Icinga Camp Berlin 2022
Our first Icinga Camp after 2019 now took place almost 3 years later and was an amazing event that took us right back in time. We tried to create an atmosphere where we could share our current state of things, introduce new features and have people who work with...
How to use path wildcards in Graphite Module
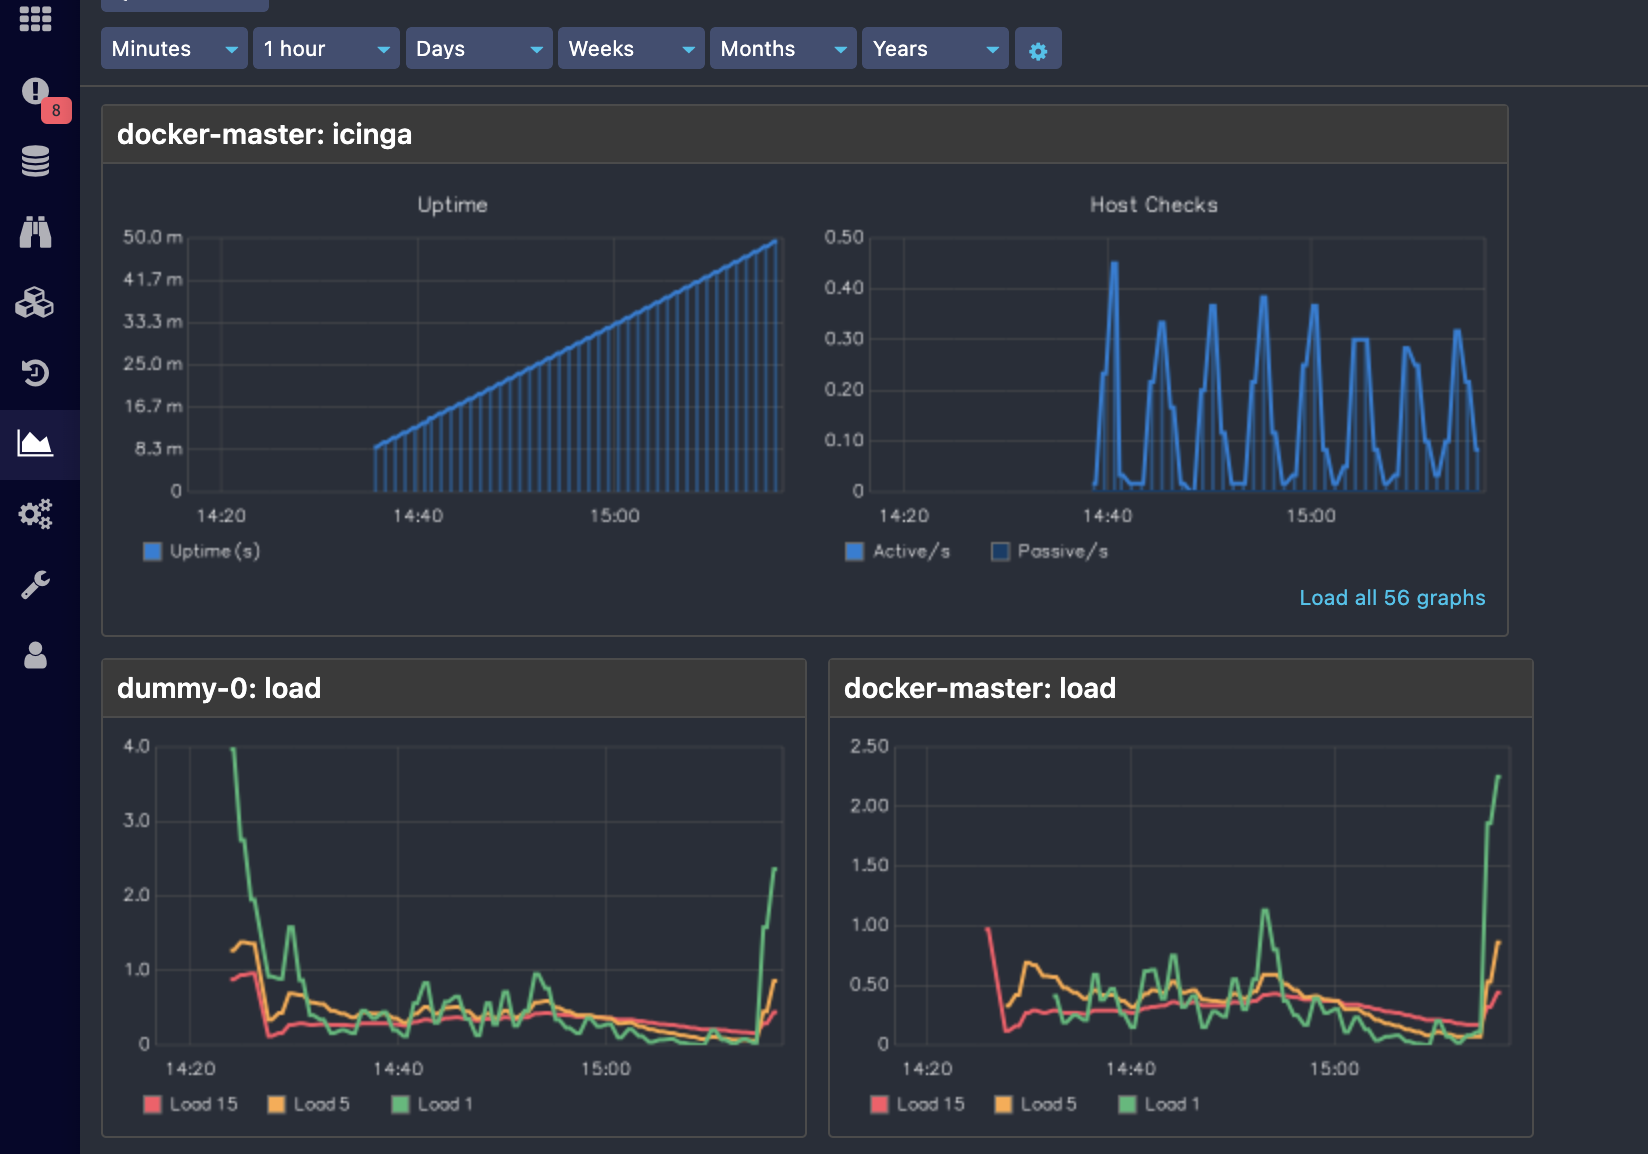
The Graphite module of Icingaweb2 is a great tool for rendering graphs from performance data. The latest version 1.2.0 introduces some bug fixes and new features like dark and light mode support, a lot of new templates, support for path wildcard, etc. The support for...
Introducing Icinga Module for vSphere – Releasing version 1.2
One of the pillars of Icinga is integrations. With it's open APIs and various extensions, Icinga is capable of integrating seamlessly into your existing infrastructure. Today I want to give you an introduction to our VMware integration and share some details about the...
Icinga Module for JIRA v1.1.0
If your team is using Atlassians Jira and Icinga and you didn't know about our integration yet: Our module for Jira is now at version 1.1.0 with a bunch of bugfixes and new features that were requested on the GitHub repository. Our friends from the internezzo ag...
How downtimes are displayed in Icinga DB Web
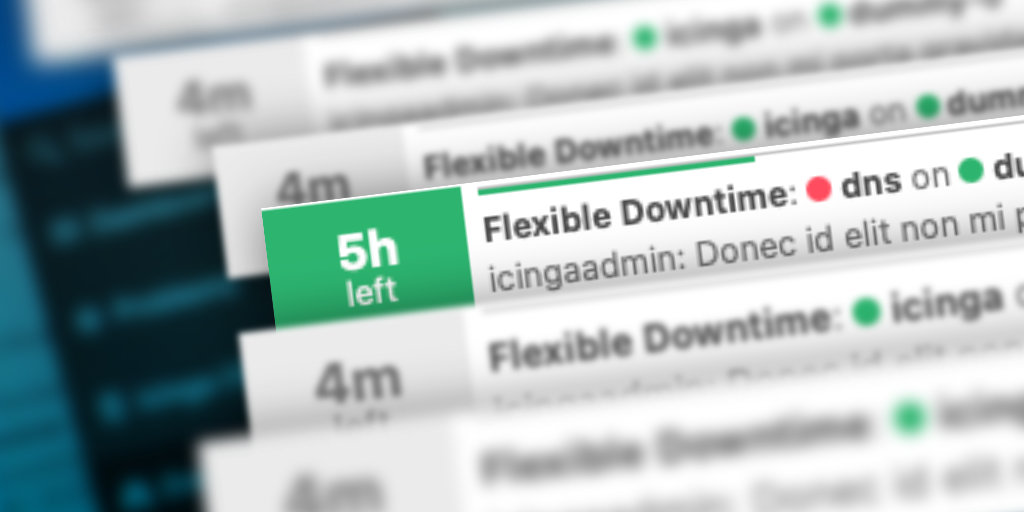
With the development of Icinga DB we not only rebuilt the core of how Icinga stores and reads monitoring data. With a complete rebuild of the monitoring module we took the chance and refined most aspects of the user interface as well. One aspect that got attention is...

Upcoming PostgreSQL Support for Icinga Certificate Monitoring
Our goal is to support both MySQL and PostgreSQL as a backend wherever we need a database. Our latest addition in this area was PostgreSQL support for reporting, which will be released in the next few weeks. We don't have PostgreSQL support for Icinga Certificate...
Icinga Business Process Modelling Version 2.3.0
The Business Process module is used to visualise all the objects in Icinga in a hierarchical format. This way, you can visualise your data in a way that fits its application! You can create custom process-based dashboards and trigger notifications at process or...

Subscribe to our Newsletter
A monthly digest of the latest Icinga news, releases, articles and community topics.