Guest post by Markus Opolka, Senior Consultant at NETWAYS. Originally published on the NETWAYS blog as “Icinga und Prometheus integrieren” and “Alertmanager-Icinga-Bridge – Ein Signalilo Fork”, combined and adapted for the Icinga blog with permission.
____
Icinga and Prometheus are both great monitoring solutions, however, their focus is different.
In this article, we look at how to integrate both monitoring systems and utilize the strengths of both tools: How to get Prometheus data into Icinga, monitoring each system with the other, storing Icinga performance data in Prometheus, and, most recently, forwarding Prometheus Alertmanager alerts into Icinga.
Icinga vs. Prometheus: what each tool is built for
When it comes to monitoring real-time metrics or short-lived services such as containers, Prometheus is the tool of choice. Icinga is often better suited for large-scale status monitoring of basic infrastructure. However, both solutions do not have to be contrary to each other, but complementary.
| Icinga | Prometheus | |
|---|---|---|
| Primary data | Host and service states, plus check performance data | Time series metrics |
| Collection model | Active checks, plus passive check results via the Icinga 2 API | Pull-based scraping of HTTP endpoints |
| Query interface | Icinga 2 API, Icinga Web filters | PromQL |
| Alert routing | Fully customisable flexible notification plugins | Alerting rules in Prometheus, routed by Alertmanager |
| Configuration | Icinga DSL, Icinga Director, Ansible or Puppet | YAML configuration and service discovery |
The rest of this post covers the tools that connect them.
check_prometheus: bringing Prometheus data into Icinga
full walkthrough with CheckCommand definitions and node_exporter examples
With the check_prometheus plugin, metrics and alarms from Prometheus can be monitored directly with Icinga. The plugin offers different functions, depending on which data from Prometheus needs to be checked.
The simplest is the “Health Check”, which monitors the availability of Prometheus:
check_prometheus health --hostname 'prometheus.internal'
OK - Prometheus Server is Healthy
With the “Query Check”, PromQL queries can be executed and transformed into an Icinga-compatible format using threshold values:
check_prometheus query -q 'go_goroutines{job="prometheus"}' -c 40 -w 27
WARNING - 1 Metrics: 0 Critical - 1 Warning - 0 Ok
If you have already defined all queries in Prometheus itself as alerts, you can use the “Alert Check” to check the status of the alerts with Icinga.
check_prometheus alert
CRITICAL - 2 Alerts: 1 Firing - 0 Pending - 1 Inactive
 \_[OK] [PrometheusTargetMissing] is inactive
 \_[CRITICAL] [PrometheusAlertmanagerJobMissing] - Job: [alertmanager] is firing
Each of these checks has many more options and the plugin is in active development. See the check_prometheus README for the full reference.
icinga2-exporter: to monitor Icinga itself with Prometheus
When you run Icinga and Prometheus in parallel, you are using two monitoring solutions at the same time.
Ideally, both should be configured so that they look after each other. This practice is often referred to as “meta monitoring”, meaning, monitoring the monitoring system.
We have developed the “icinga2-exporter” for monitoring Icinga with Prometheus. It is mainly intended for “Icinga Self-Monitoring”.
For this, the exporter provides an HTTP endpoint with metrics in Prometheus text format. These metrics can then be scraped and monitored with Prometheus.
---
global:
  scrape_interval: 30s

scrape_configs:
    - job_name: 'icinga'
      static_configs:
        - targets: ['icinga2-exporter.internal:9665']
You can also create a fancy Grafana dashboard for Icinga self-monitoring!
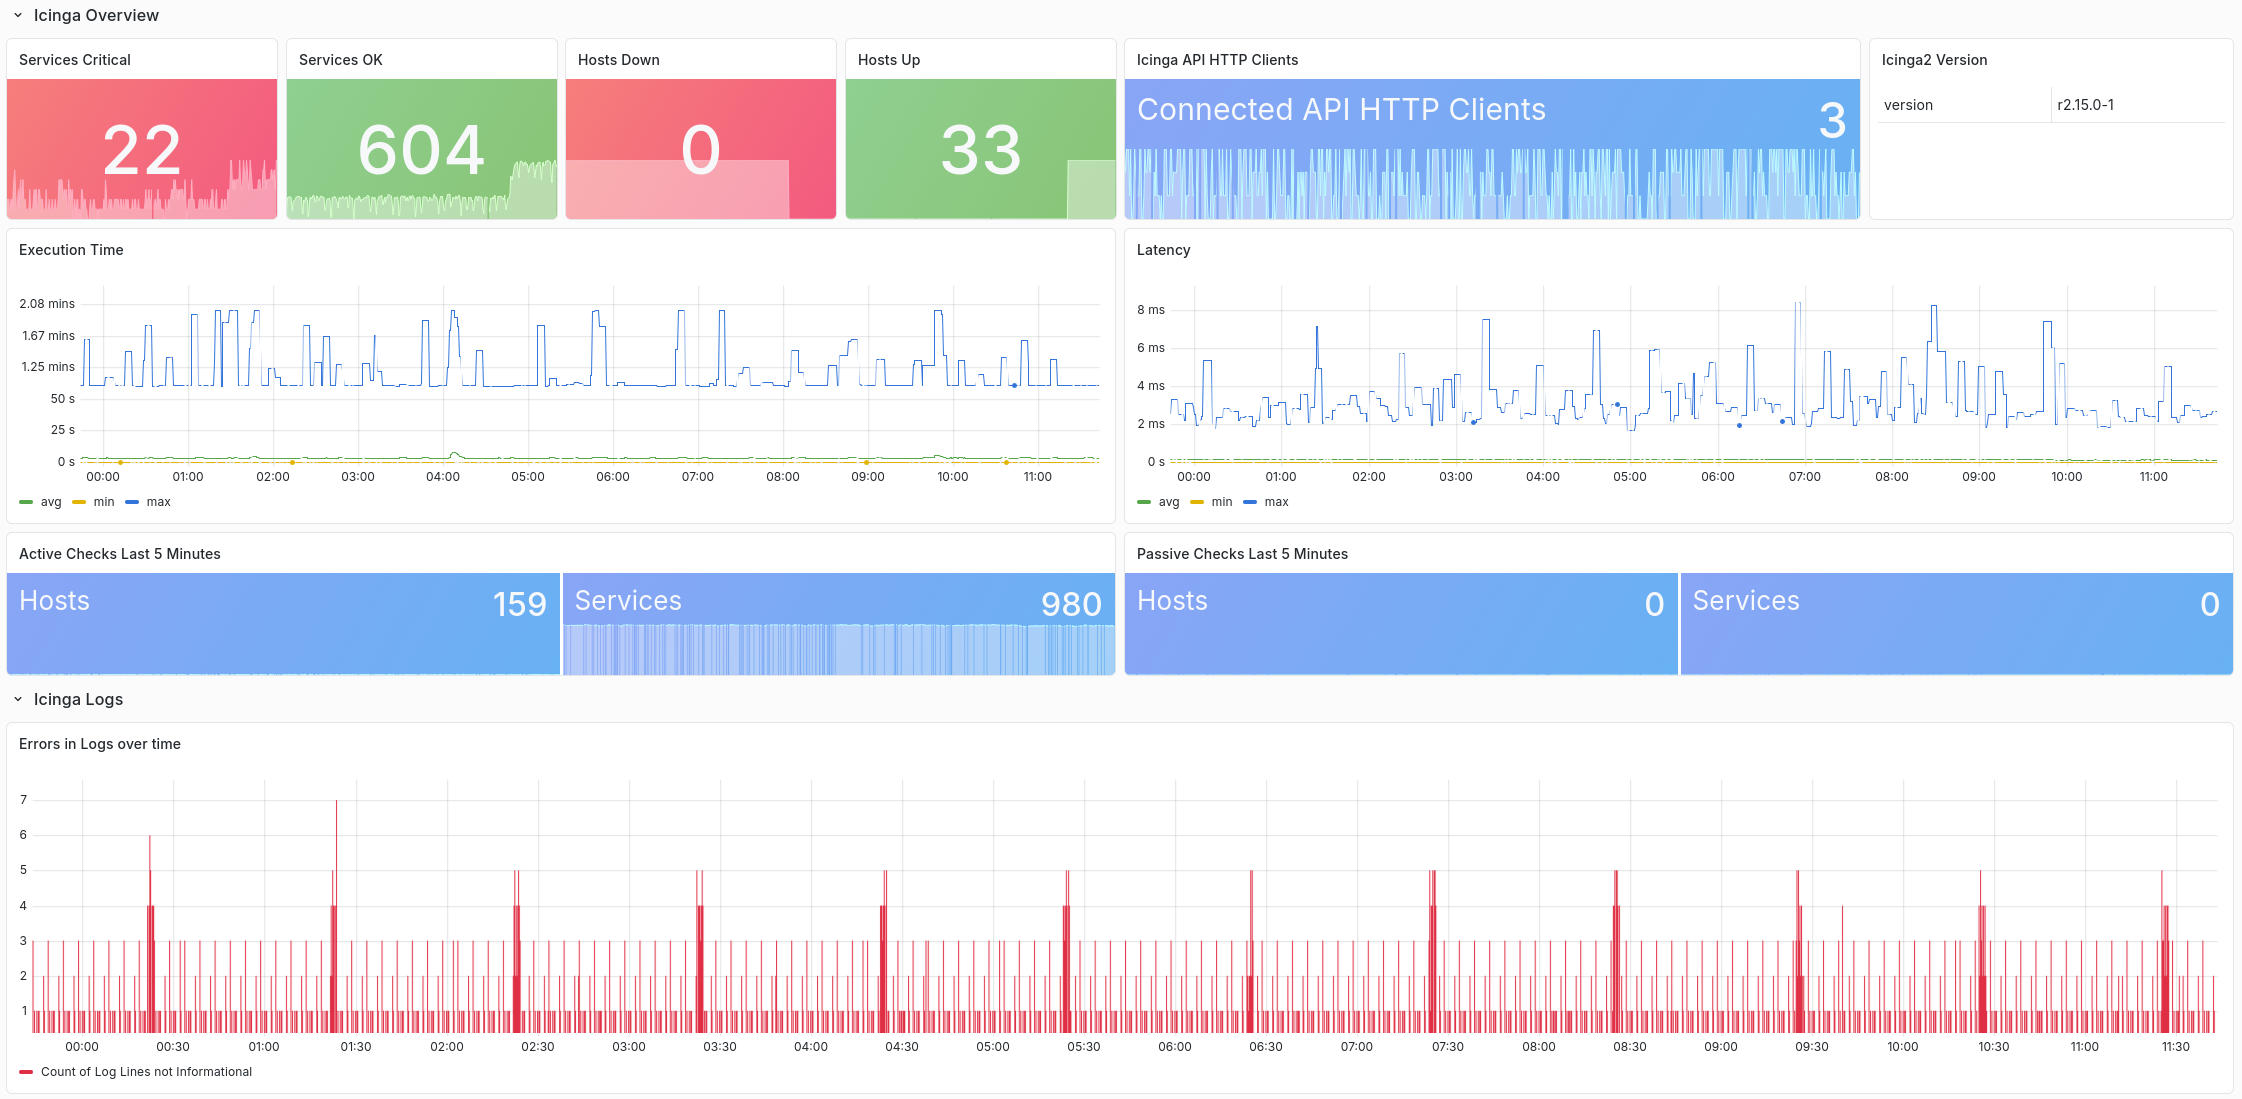
What the icinga2-exporter deliberately does not do, is send check plugin performance data from Icinga to Prometheus.
perfdatagraphs-prometheus: Icinga performance data and graphs via Prometheus
Anyone running an Icinga instance usually also wants to store the performance data of the check plugins.
For this use case, Icinga provides various “writers” that can write this data to external time series databases.
This often raises the question of which time series database to use? We at NETWAYS are of the opinion that Prometheus is a good solution here. Prometheus is stable, easy to operate and has many compatible alternatives that address issues such as high availability. For example VictoriaMetrics, Cortex, Thanos or Grafana Mimir.
And with the latest Icinga version 2.16.0 a native OpenTelemetry integration called OTLPMetricsWriter was merged.
With this new writer for Icinga, performance data can be written to Prometheus (and other databases that speak OpenTelemetry) using OTLP/HTTP.
OpenTelemetry is an open standard for telemetry that standardizes different data types (metrics, logs, traces, etc.) and establish a common transmission protocol (OTLP).
To visualize this data in Icinga Web we have developed the perfdatagraphs-prometheus Icinga Web module.
Alertmanager-Icinga-Bridge: Routing Alertmanager alerts to Icinga
The Prometheus Alertmanager and Icinga do not communicate with each other by default. If you want to process Prometheus alerts centrally via Icinga, you need a bridge between the two systems. That is exactly what the Alertmanager-Icinga Bridge does: it receives alerts from Alertmanager and automatically creates them as services in Icinga.
The tool is a fork of an existing tool named “Signalilo”. The repository is unfortunately no longer being maintained. However, we at NETWAYS believe that the tool and its use case are still useful. That is why we forked the tool under the existing “BSD-3-Clause” license as “Alertmanager-Icinga-Bridge”. The name change is intended to clearly distinguish the fork from the original project.
As part of the fork, we also gave the code a thorough cleanup. Our main goal in doing this was to simplify long-term maintenance. In addition, we’ve removed most third-party packages as dependencies and replaced them with the fantastic Go standard library. Only a single simple CLI library remains as a dependency, which makes the SBOM (Software Bill of Materials) much leaner.
What does the Alertmanager-Icinga Bridge do?
In the Prometheus ecosystem, the Alert Manager determines which alerts should be sent to whom. The actual alerts are received via an HTTP API, run through a decision tree, and are then sent to configured endpoints (email, RocketChat, webhooks, and so on). This all works even without Prometheus, so an Alertmanager cluster can serve as the central alerting solution for the infrastructure.
However, some of our customers have a use case where Icinga is supposed to handle this central function, and Alertmanager is supposed to forward incoming alerts to Icinga. Anyone familiar with the tools will realize that this integration is not a trivial matter. The “Signalilo” tool addresses exactly this use case by receiving alerts from the Alert Manager and creating them as a “service” on the Icinga API. This allows you to use the channels defined in Icinga for notifications.
NETWAYS’ Icinga and Prometheus integrations
The Alertmanager-Icinga Bridge joins our existing tools that integrate Prometheus and Icinga. This allows the strengths of the two systems to complement each other.
All tools are open source and available on GitHub:
- check_prometheus: Icinga check plugin to check Prometheus.
- icinga2-exporter: Prometheus exporter for Icinga2.
- icingaweb2-module-perfdatagraphs-prometheus: a Prometheus backend for the Icinga Web Performance Data Graphs Module.
- alertmanager-icinga-bridge: a Prometheus Alertmanager to Icinga integration via webhooks.
- notify-alertmanager: an Icinga notification plugin for the Prometheus Alertmanager.
About the author: Markus Opolka is a Senior Consultant at NETWAYS, where he works on monitoring and observability projects with Icinga and Prometheus. Find more of his write-ups on the NETWAYS Know-how blog.
FAQ
Can Icinga and Prometheus run side by side?
Yes, and it is a common setup. Prometheus handles high-frequency metrics from dynamic targets, Icinga handles state and notifications for long-lived infrastructure.
How do I monitor Prometheus with Icinga?
With the check_prometheus plugin. It offers a health check for server availability, a query check that turns PromQL expressions into Icinga thresholds, and an alert check that reports the state of Prometheus alerting rules.
Can Prometheus store Icinga performance data?
Yes, since Icinga 2.16.0. The OTLPMetricsWriter sends check performance data via OTLP/HTTP to any OpenTelemetry-compatible receiver, including Prometheus, VictoriaMetrics, Grafana Mimir, and Elasticsearch.
How do I forward Prometheus Alertmanager alerts to Icinga?
With the Alertmanager-Icinga-Bridge. It receives alerts from Alertmanager over a webhook and creates them as services via the Icinga 2 API, so Alertmanager alerts use the notification channels already configured in Icinga.