After NETWAYS has already taken a leading role in the past in maintaining the Ansible Collection Icinga, contributing features and bug fixes, it’s now official: The Ansible Collection Icinga is...
Ownership change of the ansible-collection-icinga to NETWAYS
After NETWAYS has already taken a leading role in the past in maintaining the Ansible Collection Icinga, contributing features and bug fixes, it’s now official: The Ansible Collection Icinga is...
Announcing Icinga for Kubernetes v0.3.0
We’re excited to share that Icinga for Kubernetes v0.3.0 is here! This release is packed with features designed to make monitoring your Kubernetes environments smoother, smarter, and more efficient. Let’s take a closer look at what’s new: Monitor Multiple...
Observability vs Monitoring: Enhancing, Not Replacing
In the dynamic world of IT operations, a common misconception has emerged: Observability vs Monitoring is often framed as a battle where one replaces the other. At Icinga, where open-source monitoring is our expertise, we aim to clarify this misunderstanding....

Docker: ARMed with PIes
More and more people use machines with the energy-efficient ARM chips. No wonder, after all the Raspberry Pi's processing power evolves which makes it more suitable for a wider range of use cases. For the power users there are the new 80 core servers with Ampere...
Releasing Icinga vSphere® Integration v1.6
We're happy to announce our first release of the year! Version 1.6 of the Icinga vSphere® Integration is out now and waiting to get installed on your Icinga monitoring environment. This release brings performance improvements, ships new metrics to InfluxDB and some...

Icinga DB Web deep custom variable filter
In this blog post I will introduce you to filtering, based on deep custom variables in Icinga DB Web. In Icinga Web 2 monitoring module, it is not possible to filter deep custom variables. Example of deep custom variables involving dictionaries and arrays: vars.dummy...
Releasing Icinga Web v2.9.8, v2.10.4 and v2.11.3
Today we’re announcing the general availability of Icinga Web v2.9.8, v2.10.4 and v2.11.3. These are accompanied by the release of the Icinga PHP Library in version 0.10.1. SQL Injection in Icinga DB Web If you are using Icinga DB Web, please make sure to upgrade...

Icinga DB Web Search Bar – Features & How It Works
With Icinga DB Web you can filter the list views in a very elegant and lovely manner. If you haven't tried this search bar yet, it's time to begin now. Unlike in the monitoring module, where you have to tediously filter the views based on clicking through all the...
Updates for Icinga Web Graphite and GenericTTS Integrations
Today we’re announcing the general availability of Icinga Web GenericTTS Integration v2.1.0 and Icinga Web Graphite Integration v1.2.2. What's New Both releases are mainly defined by several maintenance tasks. But of course, we wouldn't announce them on the blog...
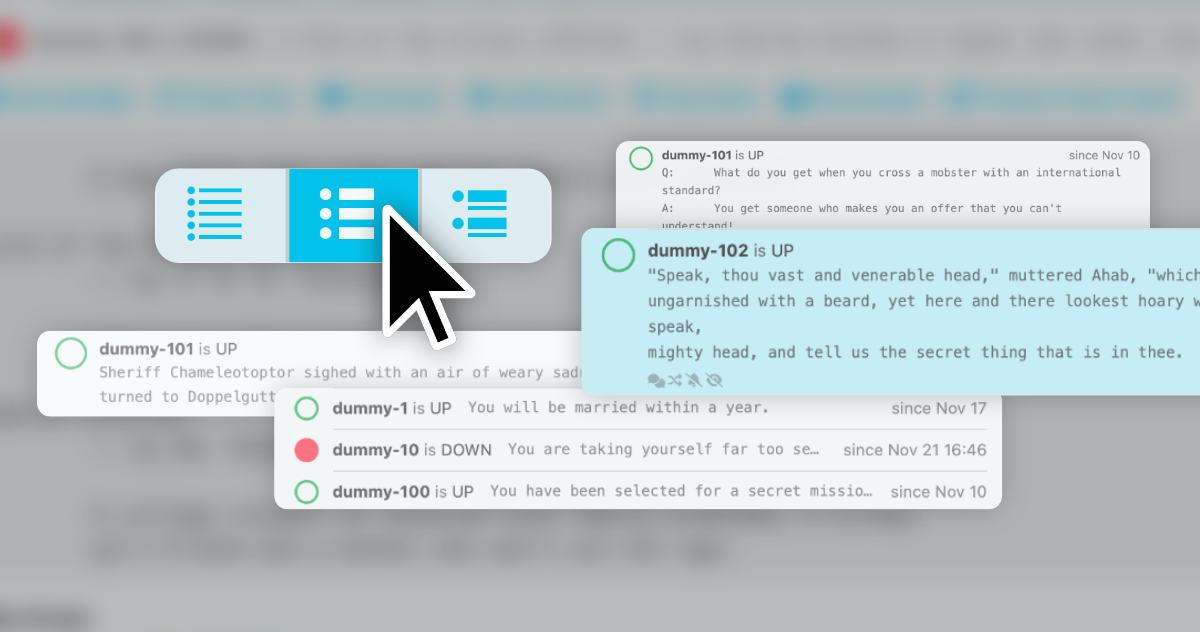
Less is more … or more is more? Decide for yourself with Icinga DB Web list view modes
With Icinga DB Web you can now customise Icinga Web's list views to your needs. While in one scenario you might be more interested to see as many objects as possible at a glance, in another scenario detail attributes of only a few objects will be more important to...

Authenticating Icinga 2 API Users with TLS Client Certificates
When interacting with the Icinga 2 API, the client is commonly authenticated using a password provided via HTTP basic auth. Icinga 2 also supports a second authentication mechanism: TLS client certificates. This is a feature of TLS that also allows the client to send...
New Releases for Icinga 2, Icinga Web and Icinga DB Web available
We've been working on a bunch of minor releases lately. Today we're happy to announce new versions for Icinga 2, Icinga Web and the Icinga DB Web module. Check out the details below. Icinga 2 v2.13.6 Today we are releasing Icinga 2.13.6. The main focus is improved...

Subscribe to our Newsletter
A monthly digest of the latest Icinga news, releases, articles and community topics.
