
NETGEAR AV Line monitoring With the new NETGEAR AV Line monitoring plugin, you can easily monitor NETGEAR AV Line devices in Icinga 2. This lightweight yet powerful Go-based tool communicates...
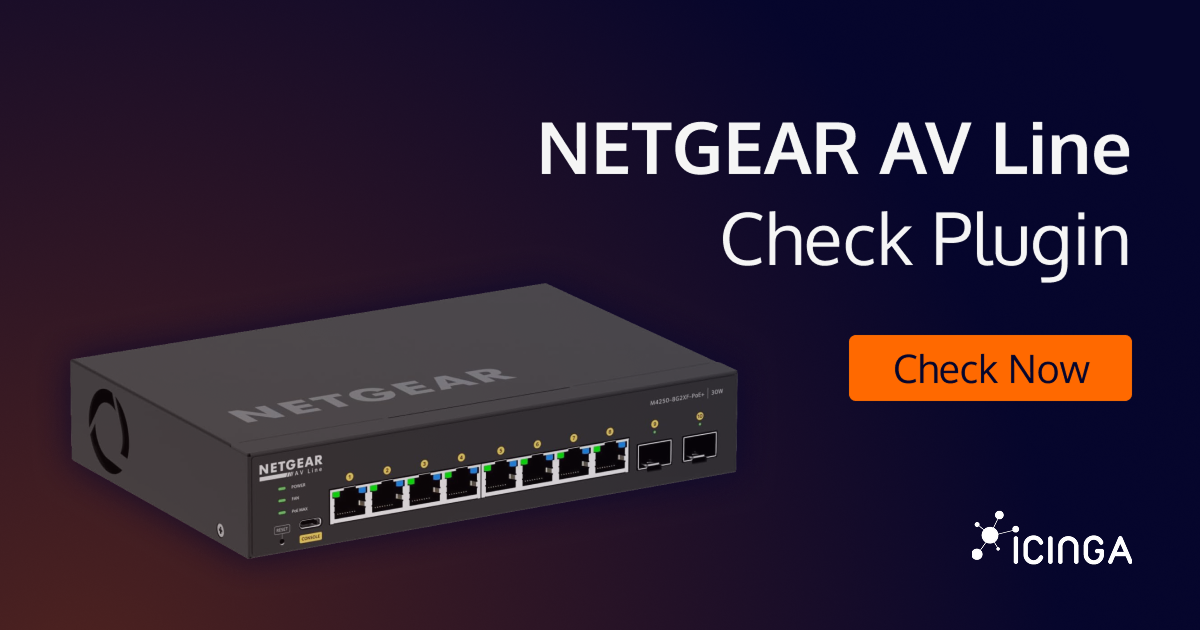
New Icinga plugin: NETGEAR monitoring with Go
NETGEAR AV Line monitoring With the new NETGEAR AV Line monitoring plugin, you can easily monitor NETGEAR AV Line devices in Icinga 2. This lightweight yet powerful Go-based tool communicates...

Icinga 2 Meets OpenTelemetry: Native Metrics Export in v2.16
The OTLPMetricsWriter is a new Icinga 2 feature available since v2.16 that exports check plugin performance data as OpenTelemetry-compliant metrics via the OTLP HTTP protocol. With a single configuration object, it connects Icinga 2 to any OTLP-compatible backend like...
Announcing Icinga 2.16.0 and 2.15.3
We are happy to announce the release of two new versions of Icinga 2 today, 2.16.0 and 2.15.3. The first one includes some new features highlighted below, as well as a number of bug fixes and other improvements. The latter one is a small bug fix release that brings...

Introducing dark and light theme modes
We are constantly working to make Icinga even better by adding new useful features. We will be releasing Icinga Web 2 version 2.9.0 very soon. This version will have many new interesting features. Update: The initial version of this article mentioned v2.9 as target...
Icinga for Windows: Hyper-V and Cluster Plugin Release v1.0
After months of developing and testing, we are finally ready to announce the release of our Icinga for Windows Hyper-V and Cluster plugins version v1.0 today! We collected lots of feedback, tested different approaches and re-designed some plugins to ensure we can...
Bring your own CI/CD.
As a developer I couldn’t imagine working without one of these three things: a search engine – which saves me thinking by myself an IDE – which saves me typing function names completely and continuous integration – which saves me running unit tests by myself on every...
Icinga Module for JIRA v1.1.0
If your team is using Atlassians Jira and Icinga and you didn't know about our integration yet: Our module for Jira is now at version 1.1.0 with a bunch of bugfixes and new features that were requested on the GitHub repository. Our friends from the internezzo ag...

Monitoring the Monitor: How to keep a watch on Icinga 2
The question is (probably) older than monitoring itself: Who monitors the monitor? While Icinga comes with countless options to monitor a wide range of devices and applications, at some point you will ask yourself how you can observe if Icinga itself is having errors....

Icinga experts are here to support you
Icinga is the perfect, powerful monitoring stack that helps you tackle your monitoring challenge. It´s open source and free to use for anybody – be it a private person, a non-profit organization or a commercial company. Why pay for support? However, although...

Creating a Business Process and adding it to Dashboard
In this blogpost I will introduce, how to create a business process from monitored hosts and services and how to add them to dashboards. Business Process module is an interesting module in Icinga Web 2. It allows you to visualise and monitor hierarchical business...

Calculating a state over multiple services
These days many setups have a lot of redundancy and you may not want to send notifications during the night, just because one of multiple http servers has a problem. This blog post will show you how to setup a single service with a state combining multiple other...
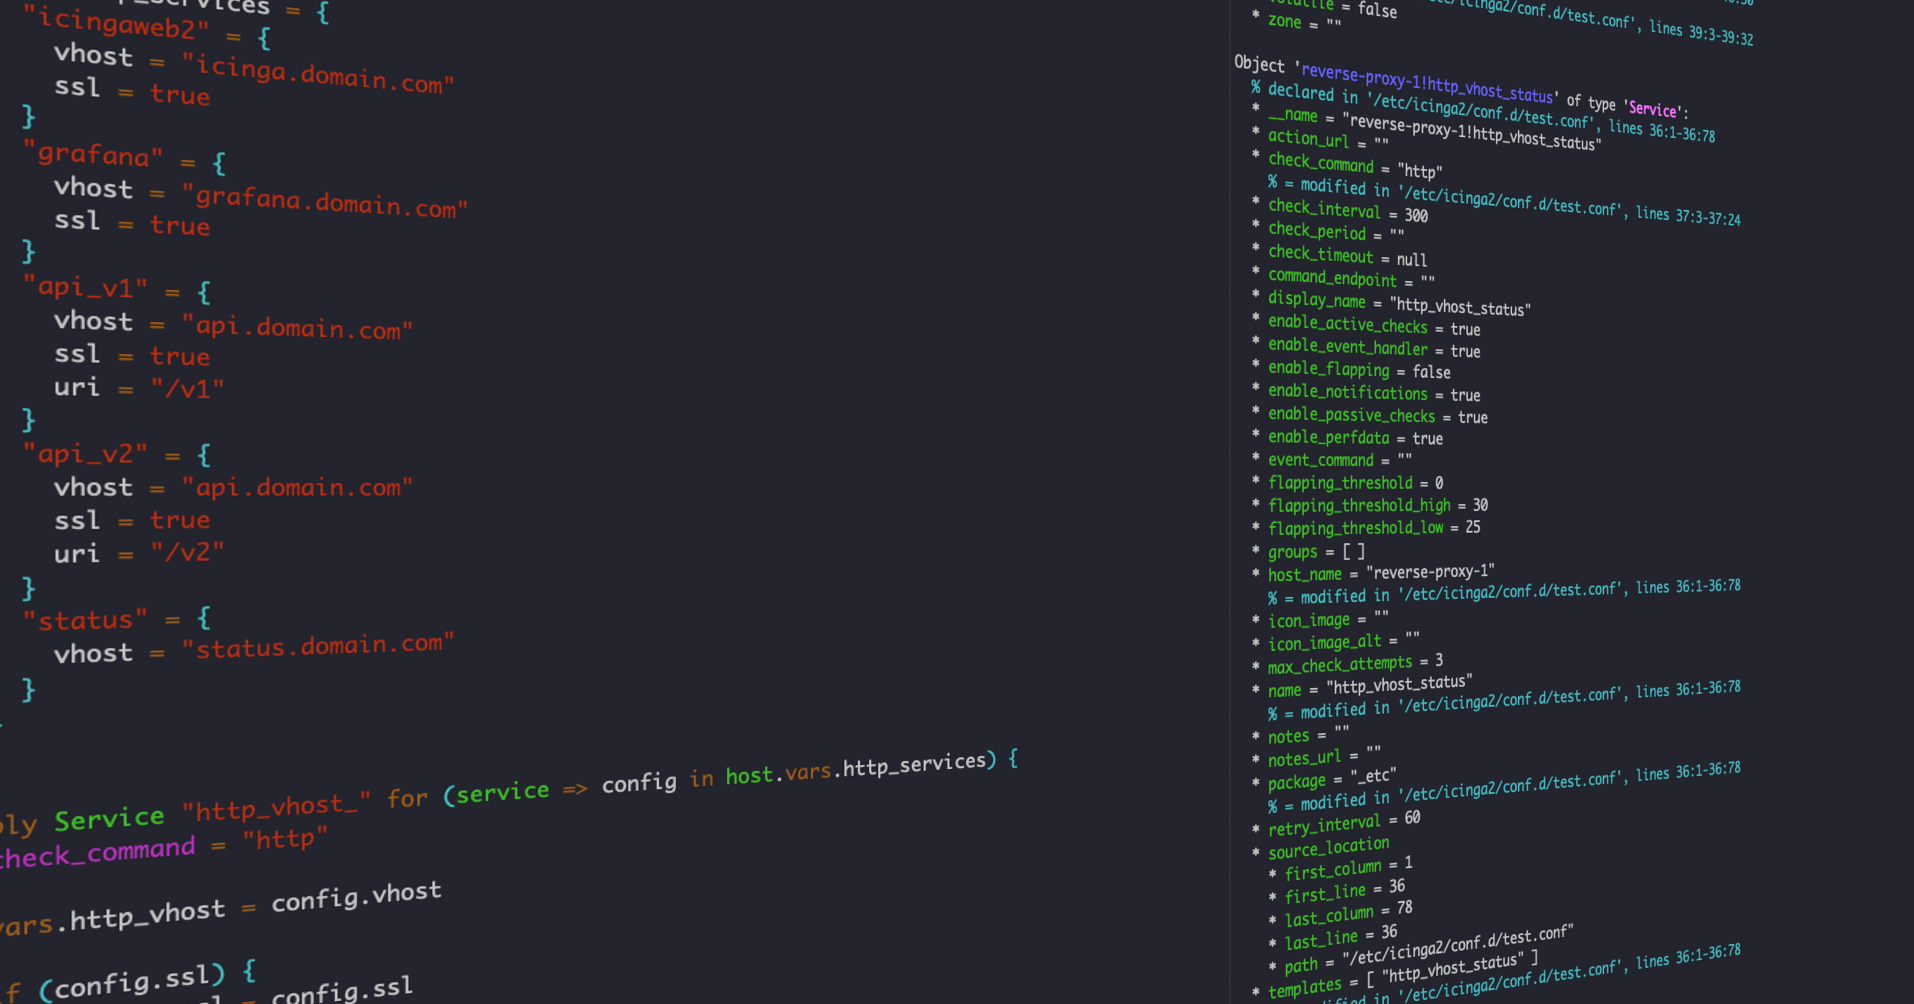
Debugging Filters and Apply Rules using the Script Debugger
Have you ever been in a situation where something in your Icinga configuration did not work as expected and you ended up doing small changes and reloading Icinga over and over again? This can be especially tricky with apply rules and filters if they don't match the...

Subscribe to our Newsletter
A monthly digest of the latest Icinga news, releases, articles and community topics.