CMake tends to have a bad reputation for being to complex and convoluted, but often that notion stems from very old versions of CMake. Sure, CMake is a Turing-complete scripting language, but that...

Modernizing a legacy CMake build-system
CMake tends to have a bad reputation for being to complex and convoluted, but often that notion stems from very old versions of CMake. Sure, CMake is a Turing-complete scripting language, but that...
XSS Vulnerability in Icinga PHP Library
Today we announce a security update for Icinga PHP Library. It solves a severe cross-site scripting attack vulnerability and affects multiple Icinga products at once. It has been published as GHSA-55wf-5m3q-6jjf. Installing the update v0.19.2 as soon as possible is...

Icinga as Open-Source MSP Monitoring Software: Multi-Tenant Monitoring for IT Service Providers
Icinga is an open-source MSP monitoring software used by managed service providers to monitor multi-tenant client environments at scale. It covers the infrastructure layer that RMM tools don't reach: network devices, custom service checks, SLA reporting, and deep...
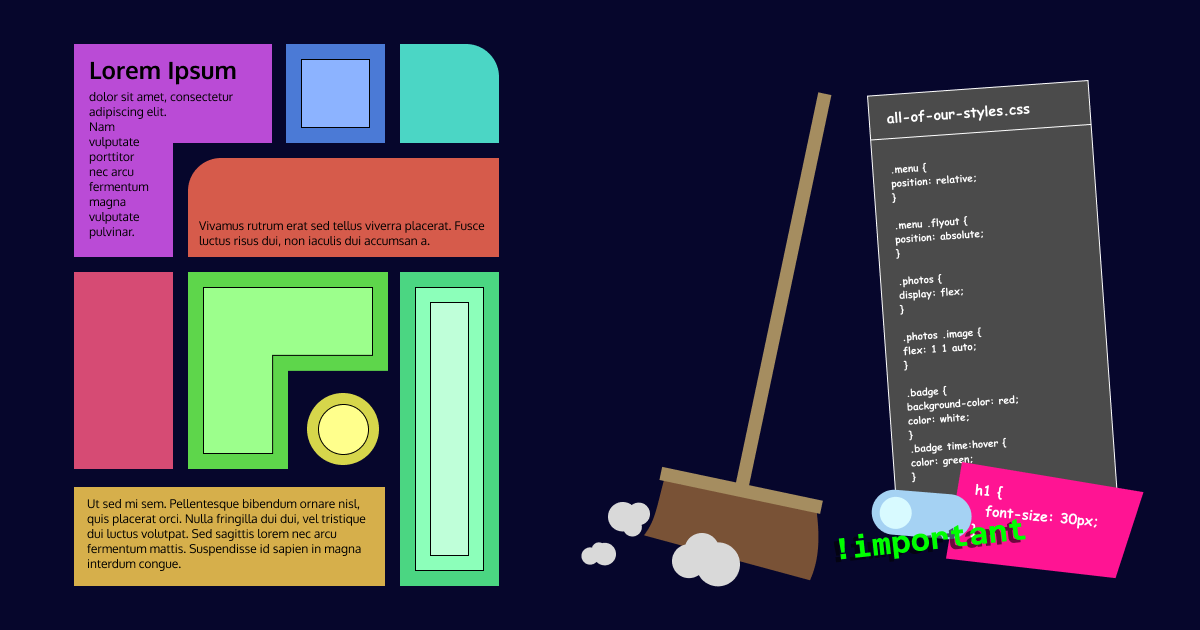
CSS doesn’t need to be ugly
Ever looked at some CSS and your first instinct was to close the editor and never look at it again? I did. Though, I don't have the luxury to close the editor in such a case, as is probably often the case for others as well. Code grows with time and so do bad...
Releasing Icinga 2.14 and 2.13.8
We are happy to announce the release of Icinga 2.14.0 and 2.13.8 today. Especially the 2.14.0 release comes with a lot of fixes and improvements and this blog post will highlight the most important ones. There are some breaking changes in 2.14.0, so please make sure...
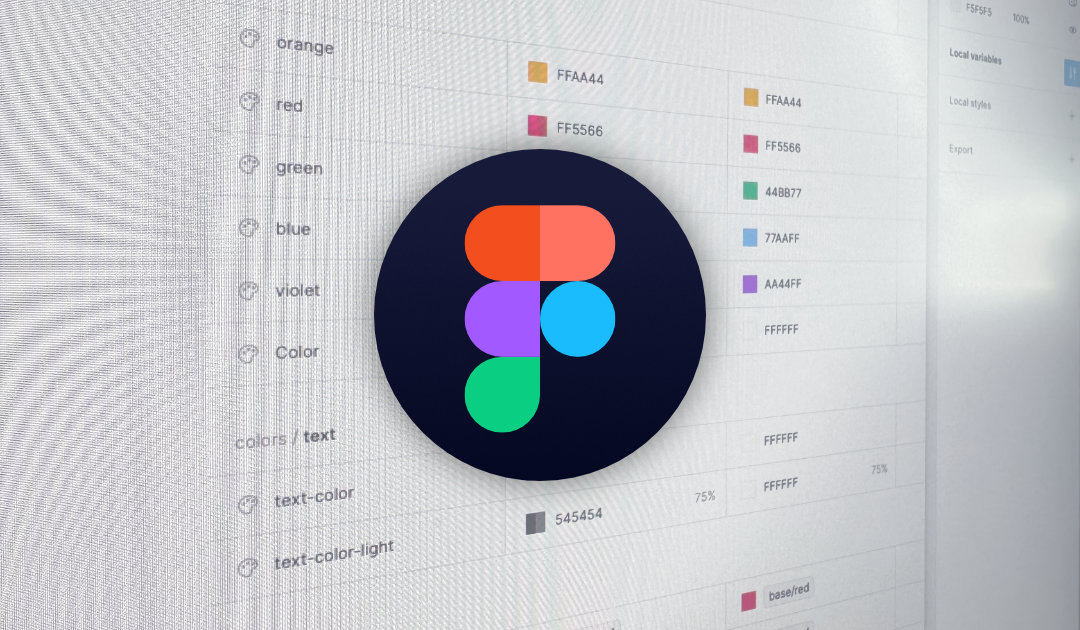
How useful is the Figma’s new variables feature?
When the news appeared that there would be a new Variables feature released for Figma, it immediately seemed huge to me. I’ve just started building the Icinga Web Design System in Figma. One of the biggest struggles was to deal with our light/dark theme modes. I...
Icinga Kubernetes Helm Charts
Daniel Bodky and Markus Opolka from our partner NETWAYS developed the very first Icinga Kubernetes Helm Charts and released it in an alpha version. If you have ever wanted to deploy an entire Icinga stack in your Kubernetes cluster, now is your chance. I also want to...

Recap of Icinga Camp Berlin 2023
It was a nice sunny morning, the weather really with us, for our Icinga Camp Berlin this year. When I peeked outside after helping with the setup, people were already mingling, getting ready to check in and get their first coffee to prepare for the day ahead. Bernd...

IPL: How to use ipl-validator
In my last blogpost I explained how our ipl-html lib works and how to use it. With the help of ipl-html it is possible to add forms. Usually we want to validate the data of the form before submitting it and display messages if the validation fails. For this purpose,...

What are infrastructure monitoring metrics?
Nowadays businesses rely heavily on robust and resilient infrastructure to deliver uninterrupted services to their customers. This includes things like servers, databases, and cloud-based systems. It's important to monitor the health and performance of this...
The most important infrastructure monitoring requirements
When setting up new monitoring software or migrating, it's important to have a strong backbone in place for the systems, so you can cover as many services with as little manual burden as possible. Of course, defining the resources - like HTTP, SSH, etc. services or...

The future of Icinga + Windows: Schrödinger’s agent?
I remember as if it was yesterday. I participated at the OSMC 2014 and watched Bernd's talk "Current state of Icinga". In the live demo Bernd has showed some of the new things we've built. One of them he introduced somewhat hesitantly IMHO: Now there is... not only...

Subscribe to our Newsletter
A monthly digest of the latest Icinga news, releases, articles and community topics.
