This is not just a version bump. Raising the PHP floor allowed us to modernize the IPL codebase in ways that were not possible before: strict type declarations throughout, and a cleaner, more...
Releasing Icinga Web v2.13 and IPL: PHP 8.5 Support & Module Updates
This is not just a version bump. Raising the PHP floor allowed us to modernize the IPL codebase in ways that were not possible before: strict type declarations throughout, and a cleaner, more...

Mirroring Icinga Packages in Air-Gapped and Restricted Environments
When hosting in a secure or corporate environment, Internet access is often restricted or blocked completely. While this makes sense from a security point of view, this introduces some challenges. For one, getting software packages. There are usually two approaches to...
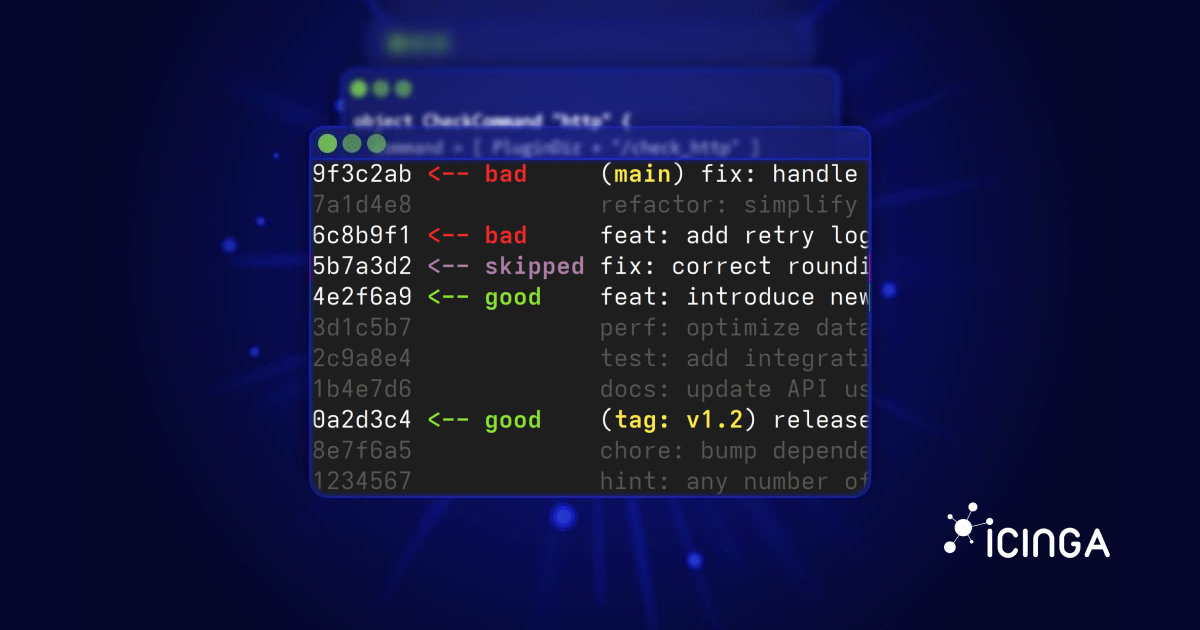
How to Use Git Bisect to Pinpoint Bugs Precisely
A feature that used to work suddenly broke. The problem? There were 300 commits since the last time I knew it worked. Checking each commit manually would take forever. Fortunately, Git has a tool designed exactly for this situation: git bisect. What is Git Bisect? The...
Releasing Icinga 2 v2.15.2, v2.14.8, v2.13.14 and Icinga for Windows v1.13.4, v1.12.4, v1.11.2
Toady, we are releasing multiple new versions of Icinga 2 and Icinga for Windows, all of them fixing a file permission issue present in all installations on Windows. Impact The following paths were created without setting proper permissions, allowing all local users...
Integrating Prometheus Metrics into Icinga Using check_prometheus
Introduction This article explains how to integrate metrics from Prometheus into Icinga checks using the check_prometheus plugin. There can be multiple reasons why this could be desired: Maybe you have different teams with their own monitoring systems, and you need to...
Testing Icinga in a Homelab Setup With Nextcloud
If you want to get started with Icinga but don’t have a data center lying around, no worries. Icinga is a lightweight monitoring tool that works for both large infrastructures and small home labs. When I first explored Icinga during my first year as an apprentice, it...
SolarWinds Alternative: Why Icinga Is the Open Source Option for Scalable Infrastructure Monitoring
Searching for a SolarWinds alternative usually happens at a turning point. For some organizations, it starts with a renewal quote that exceeds expectations. For others, it follows a strategic review of vendor risk, subscription lock-in, or long-term monitoring costs....
Icinga Insiders: Collaborating With Users to Improve Icinga Web
Icinga Insiders: How User Research Shapes the Future of Icinga Web Icinga Insiders is one of our core initiatives for involving users directly in the ongoing development of Icinga Web, its modules, and new functionality. Through structured research sessions, we gain...
Releasing Icinga DB v1.5.1
Today we are announcing the release of Icinga DB version 1.5.1. This release addresses the issue of leaking SQL prepared statements when Icinga DB is configured as a source for Icinga Notifications. Each time the custom variables for an Icinga Notifications event were...

Exploring C++20 Coroutines: A Practical Look at Stackless Coroutines vs Boost.Coroutine2
Introduction Icinga 2 makes heavy use of Boost.Coroutine2 in our network code, which are stackful coroutines that are designed to work well with the IO operations from Boost.Asio. This has proven to be a challenge whenever we wanted to asynchronously await things...
Monitor One Icinga 2 Cluster From Another
Icinga is designed to be a highly dynamic monitoring software that can monitor your setup, regardless of its architecture. While most setups are hierarchical and fit well into the master, satellites, and agents scheme with different zones, it is sometimes impractical...
Drowning in Alert Fatigue? How to Regain Control of Your Monitoring
Introduction: Why Alert Fatigue Hits Sysadmins Sooner or Later If you’ve ever muted your phone during a maintenance window, only to miss a real outage an hour later, you’re not alone. Sysadmins on Reddit and beyond often describe feeling like they’re drowning in...

Subscribe to our Newsletter
A monthly digest of the latest Icinga news, releases, articles and community topics.
