
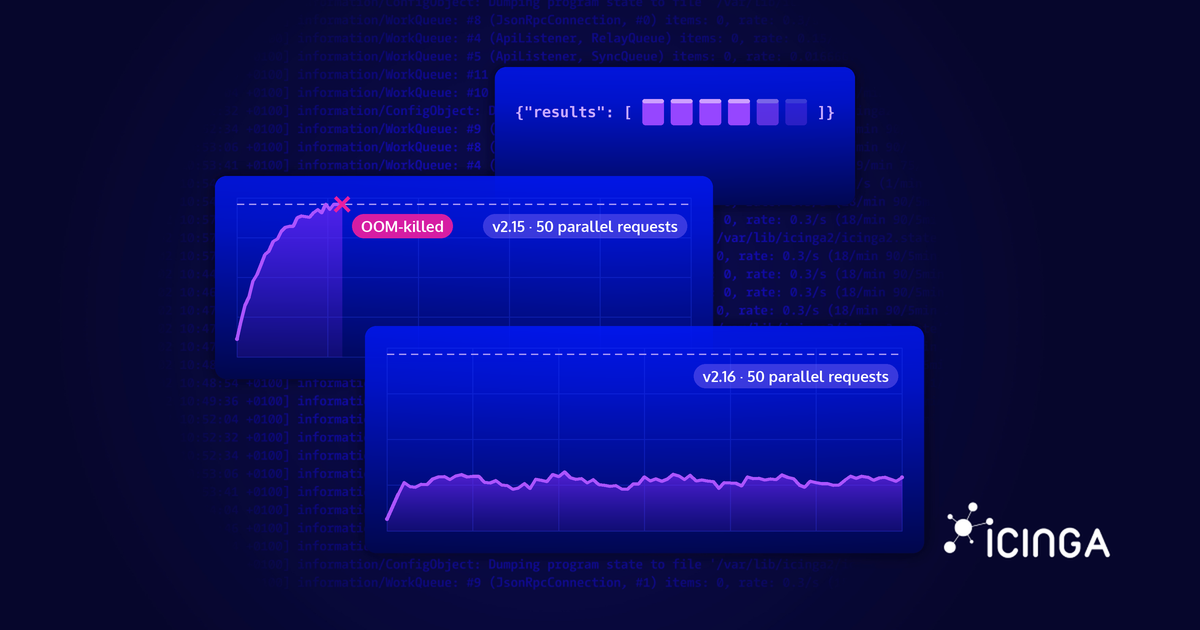
Sometimes you just want to fetch all Icinga 2 objects of a given type from the API and do something with them. Then you notice that Icinga 2’s memory usage jumps up with every large request and never comes back down, as if each HTTP request leaked a huge chunk of memory. And once enough of these requests run in parallel, no matter how much RAM the machine has, Icinga 2 runs out of memory and crashes.
Here’s what was really going on, and how we fixed it in Icinga 2 v2.16.
The Problem
In medium to large environments, Icinga 2’s memory usage jumped up with large API requests and stayed there even after the requests had finished. Normally, that pattern points to a memory leak. Icinga 2 wasn’t actually leaking memory, though. Instead, it built every API response entirely in memory, which made each request expensive, and the system’s memory allocator (glibc’s malloc() in most cases) kept that memory after it had been freed, which made it look like a leak.
Building Every Response in Memory
Before sending a single byte, Icinga 2 built the entire response in memory. It created a dictionary per object, values and keys for every attribute, and then the complete JSON string encoded from all of it. The more objects and attributes were requested, the bigger all of this got. In a large environment, that added up to millions of small allocations for a single request. And that’s just one request. Icinga 2 serves every connection in its own coroutine on a pool of I/O threads, so many requests can be in progress at the same time, each holding its own complete copy of the response in memory. The peak memory usage is therefore the sum of all responses being built at that moment. A couple of parallel requests may still fit into memory, but a few dozen of them won’t, and the OOM killer terminates Icinga 2.
Freed but Not Returned
When glibc frees a small or medium-sized chunk, it usually keeps that memory for future allocations instead of returning it to the kernel. Only allocations above the mmap(2) threshold (128 KiB by default) are served by mmap(2) and returned as soon as they are freed. Even that threshold isn’t fixed. Whenever such a block is freed, glibc raises the threshold to the block’s size, up to 32 MiB on 64-bit systems. After a few large responses, even big buffers like the final JSON string are served from the heap instead of being mapped separately.
Memory served from the heap, on the other hand, can only be returned to the kernel from the top. The heap is one contiguous region that grows upwards by moving the end of the process’s data segment, the so-called program break, with sbrk(2). When free(3) notices that the free space at the very end of the heap has grown beyond a threshold (M_TRIM_THRESHOLD, 128 KiB by default), it moves the program break back down and the kernel reclaims those pages. The program break can only move back and forth, though, so there’s no way to cut out a chunk in the middle of the heap. While a response is being built, the rest of Icinga 2 keeps allocating too, so a single allocation that is still alive above the response’s memory is enough to keep all of it in the process. The memory isn’t lost, though. glibc reuses it for the next requests, so Icinga 2 doesn’t grow forever. It just stays at its peak instead of going back down, and that’s what made it look like a leak.
To confirm that this wasn’t a memory leak, we experimented with malloc_trim(3), which forces glibc to release free memory back to the kernel. Unlike the automatic trimming, it doesn’t stop at the top of the heap. It walks all free chunks in every arena and uses madvise(2) to tell the kernel that any whole pages inside them are no longer needed. The address range stays reserved for the process, but the physical memory behind it is released. When we called it after each API request from within a debugger, Icinga 2’s memory usage dropped back to its original level. This confirmed that the memory wasn’t leaked, just never returned to the OS.
What We Tried First
Before rethinking the code itself, we tried a few workarounds. The first was to recommend users to switch to a different memory allocator, such as jemalloc(3). That helped on some systems but made things worse on others. The second idea was to call malloc_trim(3) from Icinga 2 itself, either through a new API endpoint that lets users trigger it or through a timer that runs it periodically. Neither approach was ideal, and it was a bit of a shame to make users take manual action just to keep Icinga 2’s memory usage under control. They didn’t address the real cause either. Trimming only gives memory back after the requests have finished. It doesn’t lower the peak while they’re running.
Streaming the Response
So we took a closer look at the code. The first thing we noticed was the one already mentioned, namely that Icinga 2 built the complete result in memory before sending it to the client. That was not only wasteful in terms of memory, but also sometimes a waste of time. For example, if the client hung up right after sending the request, Icinga 2 would still build the complete result in memory before noticing that the client was gone, burning CPU cycles and memory for nothing. We needed to radically change the way API responses were produced.
This is where streaming comes into play. Instead of building the complete result in memory, Icinga 2 now prepares and serializes one object at a time and writes it to the connection right away. Since we use buffered TLS streams, some buffering still happens, but it’s bounded. Once about 128 KiB of encoded JSON has accumulated, the response is flushed to the client. That keeps memory usage low without paying the I/O overhead of writing every few bytes. And because each flush is a write to the socket, a client that has gone away is noticed at the next flush, and the request is aborted instead of running to completion.
The tricky part was compatibility. Existing clients expect exactly the same response format as before, which looks like this.
{"results": [{...}, {...}, ...]}
So the response can’t simply be a stream of loose objects in NDJSON format. Instead, the JSON encoder writes the envelope around a lazy generator that produces the objects on demand. At any point in time, only a single object and at most about 128 KiB of encoded JSON live in memory per request. The client receives exactly the same JSON document as before, just delivered in chunks. As a result, Icinga 2’s memory usage stays flat, no matter how many objects are requested or how many concurrent requests are running, as shown in the following graph.
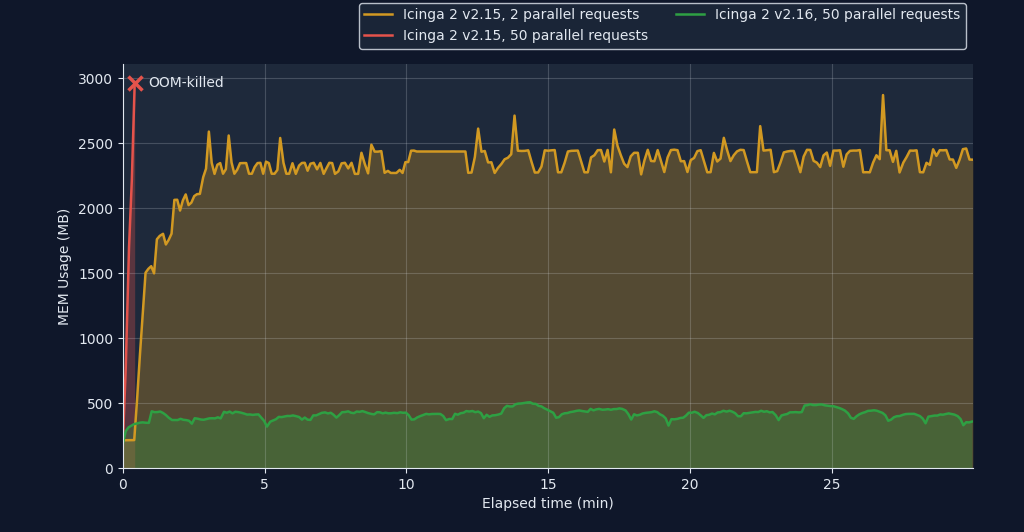
The graph above shows the memory usage of three runs. With 50 parallel API requests, v2.15 reached almost 3GB (which is also the upper limit) within half a minute and was OOM-killed. With only two parallel requests, v2.15 survived the full 30 minutes, but it held on to around 2.3 to 2.5GB the whole time. v2.16 served the same 50 parallel requests as the first run and stayed between roughly 300 and 500MB for the full 30 minutes.
What This Means for You
Streaming responses are available starting with Icinga 2 v2.16.0. They cover the object query endpoints (/v1/objects/<type>) as well as the other endpoints that can return large result sets, such as /v1/types, /v1/templates/<type>, /v1/variables, /v1/actions/*, and object modification and deletion requests. The /v1/events endpoint streams its events the same way. If you’ve been affected by this problem, we recommend the following steps.
- Upgrade to v2.16.0 or later.
- Remove any workarounds in place once you’ve upgraded, such as an alternative allocator loaded via
LD_PRELOADthat you only introduced because of this issue.
No API or configuration changes are required. Your existing scripts and integrations keep working as before, just without dragging Icinga 2’s memory usage up with them.