When you work closely with Icinga Web 2, developing modules, building dashboards, poking around the internals, you naturally pick up on features that most users never think about. Some are usability...

Features in Icinga Web 2 Worth Knowing About
When you work closely with Icinga Web 2, developing modules, building dashboards, poking around the internals, you naturally pick up on features that most users never think about. Some are usability...
Monitoring Docker Containers with Icinga
A container reporting "up" tells you the process is running, not that the workload is healthy - but that caveat is true of any service, on a container or a bare server. What makes containers their own monitoring problem is the layer around the process: per-container...
IPL: How to use the ipl-web TermInput
Most form fields ask users for a single value like a name, an email, or a date. But some need a list of values. A plain text input with comma-separated values can technically do the job, but it gives no feedback while typing, no suggestions, and one invalid entry...
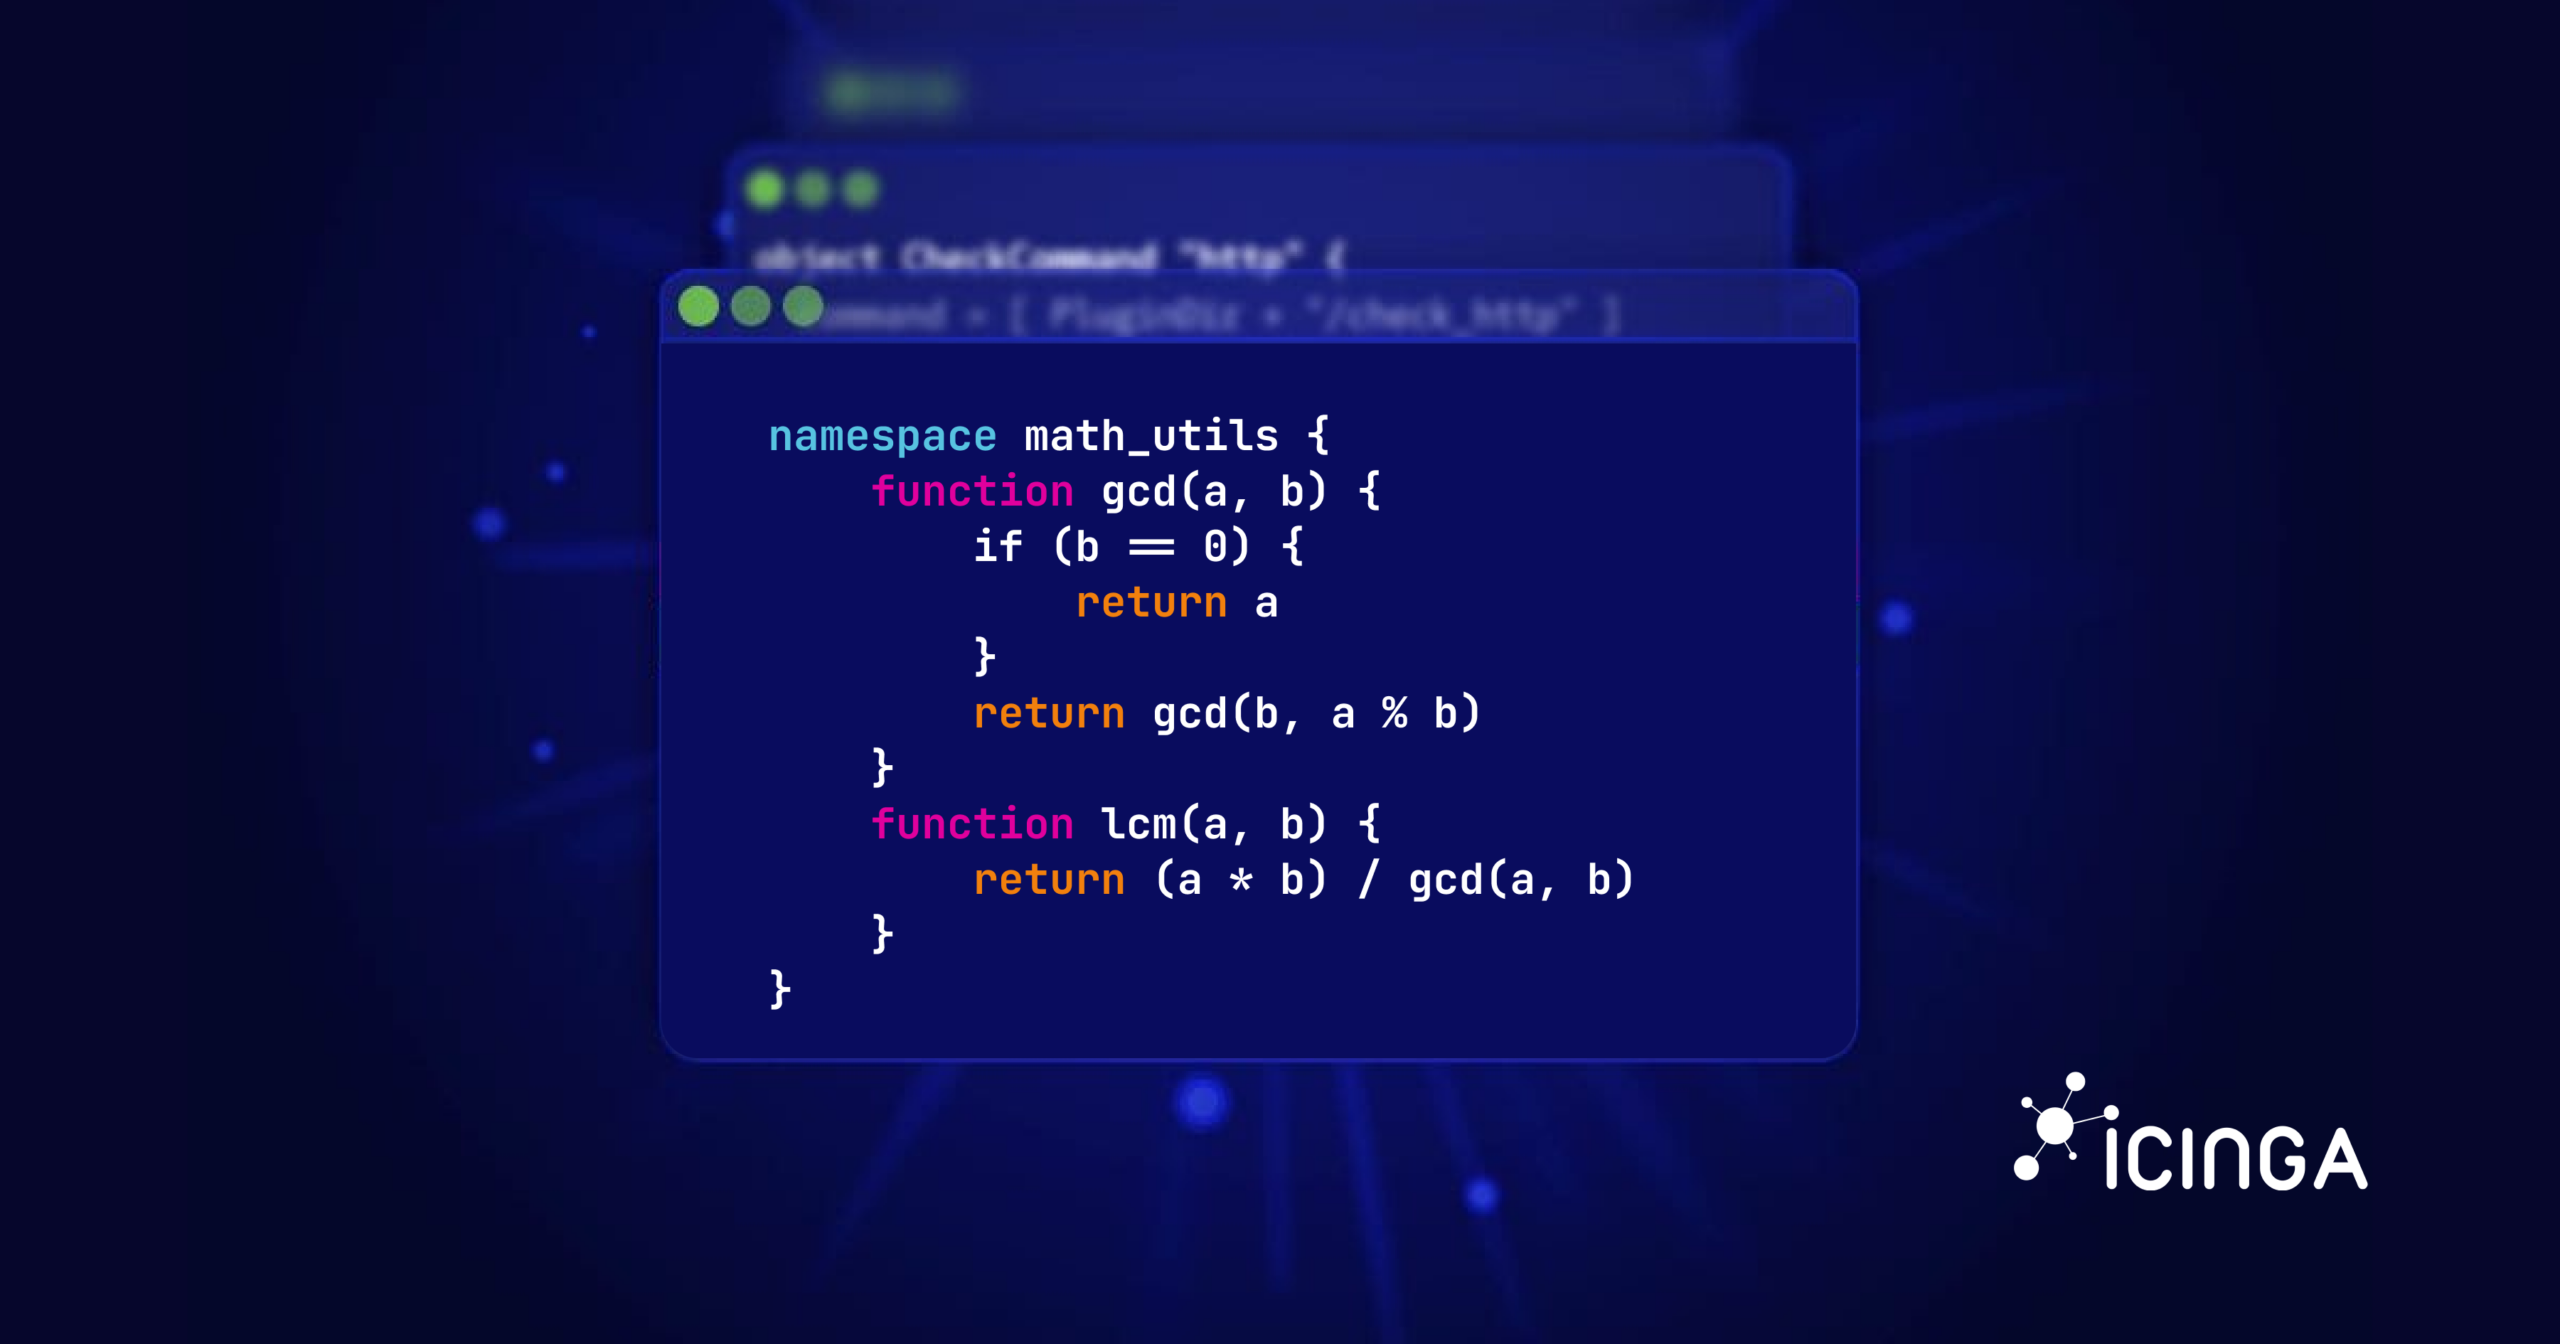
Understanding Namespaces in Icinga 2 DSL
Last time, we explored the concept of variable scopes in Icinga 2, which help you manage and organize your DSL configurations effectively. As promised, today we'll dive into another, how shall I say, advanced topic: Namespaces in Icinga 2. What are Namespaces?...

Integrating Prometheus Metrics into Icinga Using check_prometheus
Introduction This article explains how to integrate metrics from Prometheus into Icinga checks using the check_prometheus plugin. There can be multiple reasons why this could be desired: Maybe you have different teams with their own monitoring systems, and you need to...

Testing Icinga in a Homelab Setup With Nextcloud
If you want to get started with Icinga but don’t have a data center lying around, no worries. Icinga is a lightweight monitoring tool that works for both large infrastructures and small home labs. When I first explored Icinga during my first year as an apprentice, it...

Exploring C++20 Coroutines: A Practical Look at Stackless Coroutines vs Boost.Coroutine2
Introduction Icinga 2 makes heavy use of Boost.Coroutine2 in our network code, which are stackful coroutines that are designed to work well with the IO operations from Boost.Asio. This has proven to be a challenge whenever we wanted to asynchronously await things...

Monitor One Icinga 2 Cluster From Another
Icinga is designed to be a highly dynamic monitoring software that can monitor your setup, regardless of its architecture. While most setups are hierarchical and fit well into the master, satellites, and agents scheme with different zones, it is sometimes impractical...

Drowning in Alert Fatigue? How to Regain Control of Your Monitoring
Introduction: Why Alert Fatigue Hits Sysadmins Sooner or Later If you’ve ever muted your phone during a maintenance window, only to miss a real outage an hour later, you’re not alone. Sysadmins on Reddit and beyond often describe feeling like they’re drowning in...

Ipl-html: Introducing new Form Element Decorators
A Fresh Take on Form Element Decorators Decorators have always been a powerful concept in Icinga Web’s form system — letting developers control how form elements are displayed without hardcoding markup everywhere. But until recently, the decorator system had its...

Using Icinga 2 on NixOS
I use NixOS by the way. And today I'm going to show you how to operate a simple Icinga setup using that operating system. I.e. a single node with checks and notifications. In contrast to Icinga Web 2 or Redis, NixOS provides an Icinga 2 package, but no module....
How to check CPU usage on Linux
When your Linux system feels sluggish, one of the first things to investigate is the CPU usage. The CPU (Central Processing Unit) is the brain of your machine, and if it’s overloaded, everything else slows down. In this guide, you’ll learn different ways to Linux...

Subscribe to our Newsletter
A monthly digest of the latest Icinga news, releases, articles and community topics.
