Automating the monitoring process for a huge amount of servers, virtual machines, applications, services, private and public clouds is a main driver for users when they decide to use Icinga. In fact, monitoring large environments is not a new demand for us at all. We experienced this challenge in tandem with many corporations for many years. Finally, it lead us to build features like our rule based configuration, Icinga’s REST API and various modules, cookbooks, roles and playbooks for different configuration management tools.
All these methods make it easier to automate monitoring in their own particular way. We created multiple ways to automate monitoring because there is not only one way to do it right. As usual in the IT field “it depends”. It depends on your infrastructure and either one way or another may be the right way for you to automate your monitoring.
Beyond the Static
Icinga Director was built with all that in mind. The Director is a module for Icinga that enables users to create Icinga configuration within a web interface. It utilizes Icinga’s API to create, modify and delete monitoring objects. Besides the plain configuration functionality, the Director has a strong focus on automating these tasks. It provides a different approach that goes far beyond a well-known static configuration management. With thoughtful features the Icinga Director empowers operators to manage massive amounts of monitoring objects. In this article I put my attention on the automation functionality of Icinga Director, even though creating single hosts and services manually is also possible of course.
Importing existing Data
In almost every company there’s a database (or something similar) that holds information about the currently running servers and applications. Some use dedicated software to manage this information. Others use tools they have built themselves or they rely on their config management tools.
While most people refer to this database as a CMDB (Configuration Management Database) there are also other common terms. In theory, only one database exists within an organization, allowing everyone involved to manage the information in a single place. In practice, most organizations spread the data across a number of different tools. While there are some professional approaches, there are also some not-so-professional ways of maintaining this data. Have you ever seen someone keep their IP addresses and locations of servers in an Excel file? We’ve seen it all.
Creating the source
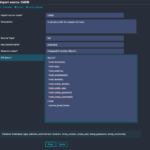
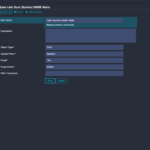
The Director has a feature called Import Source. It allows you to import many different kinds of data. The data does not have to be in the Icinga configuration format, the Director will take care of that later. For a start, you only need some kind of data, be it a simple textfile or a fully grown CMDB tool. In my very simple example, I’m using a MySQL database, which is a common storage for this type of information. My database cmdb contains only one table hosts that holds everything I know about my servers. For demo purposes, this is perfect.
- Import Source
- Preview
- Connection Resource
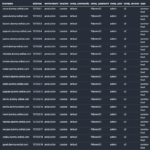
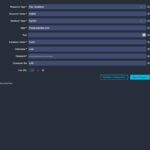
Creating the import source requires access to the database server. The credentials are stored in an Icinga Web 2 resource, therefore they are re-usable. After triggering a Check for changes you can preview the data set in the Preview tab. If everything that you need is included, you can trigger the import run which actually imports the data. Starting from here your data is generally available and you can create Icinga configuration out of it. The properties may also be modified during the import, but I leave them as they are for now. (Learn more about available modifiers)
Using SQL, LDAP or something else
In the example above I used the source type SQL which is built-in and available by default. You can use other source types as well, for example LDAP. That allows you to import not only objects that have to be monitored, but also users from your LDAP or Active Directory and use the contact information for alerts. There are also other Import Sources available, such as plain text files (including JSON, YAML, CSV and more), PuppetDB, vSphere or AWS. New Import Sources are added to the Director as Modules, which you can also write yourself. Our lovely community is continuously extending the Director with new import sources as well, for example with import sources for Microsoft’s Azure or Proxmox VE.
Synchronize your Data with Icinga
After a successful import you can continue with the config synchronization. Syncing configuration means, that you use the imported data to generate Icinga configuration out of it. Generally speaking, you map your data fields into Icinga objects and properties.
Some of the data imported above is easy to map, such as hostname and IP address. Icinga has pre-defined config parameters for those. Others, like the location and environment of the servers are mapped to custom variables. Custom Variables are something like tags, but with extended functionality. They can be plain strings but also booleans, arrays and even dictionaries (hashes). Custom variables are usually used to store meta information about your objects. Based on the information stored in custom variables you can later create rules to define what exactly should be monitored on which node.
Create a Sync Rule
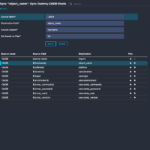
Creating a new Sync Rule requires some input and some decisions. You define what kind of monitoring objects you’re going to create out of your imported data. This can be Hosts, Endpoints, Services, User, Groups and others. In my example I simply choose to create Host objects. After that, you decide what should happen with existing monitoring configuration. Shall it be replaced by the new one, merged or ignored? Once the Sync Rule is created you can finally start to tell the Director how to map your data to Icinga configuration attributes. This is done within the Properties tab by creating new sync property. For every column in the table I create a Sync Property.
- Sync Rule
- Property Mapping
- Preview
Checking for changes will only do a dry run so you can see if there are any changes available. Triggering the Sync actually synchronizes the new configuration with the existing one and automatically creates new entries in Director’s activity log. At this point, everything is ready to be deployed to Icinga.
Deploy new Configuration
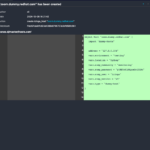
The Director’s activity log shows precisely what changes are waiting to be deployed to Icinga. Clicking on each element displays the exact difference between old and new configuration. This diff format may be familiar to you from Git for example. Additionally, you can view the whole history of past configuration deployments.
Traveling in Time
The Activity Log contains every configuration change that you ever made with the Director. It lets you travel back in time and deploy old configs if necessary. The Director’s history of Deployments basically works like a Git history: You can do a diff between certain deployments to track the changes and see which user deployed which configuration at what time.
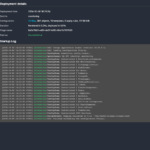
The simplest way of deploying your new configuration is by just clicking Deploy pending changes. Your config will be pushed to Icinga and validated. If there’s anything wrong, you will receive a log with the details and your production configuration remains untouched.
- Activity Log
- Single Config Diff
- Deployment
Automation
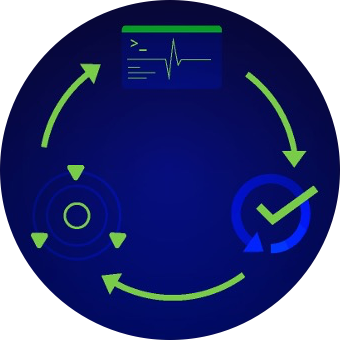
As mentioned in the beginning of this post, automation is a key aspect of Icinga Director. The steps described above (Import, Synchronise and Deploy) can all be automated once they are fully configured. The automationis done by creating Jobs.
With each Job running one certain task in a specified period. The frequency of a Job is freely configurable. It may run every hour or only once a day. You decide if you want to create a Job only for a specific task, or for all of them.
Want to see it live?
Join our free webinar “Icinga Director for Practitioners” on 02 December 2025 to get a visual deep dive into Icinga Director’s architecture, data imports, change tracking, and automation hooks. Recording will be available on register page after this date
Conclusion
The workflow described above was only a sneak peek into the capabilities of Icinga Director. This scenario demonstrates the basic functionality and what you can do with it. There are many more features left out in this article like modifying imported data, merging data from multiple data sources, and filtering or creating custom data sets.
Check out the full Director Documentation to get started with your monitoring automation project.

