Shadow-Soft has been our key partner in North America for more than a decade. During this time, they have built a strong enterprise monitoring practice around Icinga and successfully delivered...
Icinga Partnering in Action: The Shadow-Soft Success Story
Shadow-Soft has been our key partner in North America for more than a decade. During this time, they have built a strong enterprise monitoring practice around Icinga and successfully delivered...
Icinga Director v1.11.6 Release
We are happy to announce the release of Icinga Director version 1.11.6. This release addresses several important bug fixes and introduces improvements that enhance the overall stability of Icinga Director. Database Schema Upgrade Columns storing large strings for...
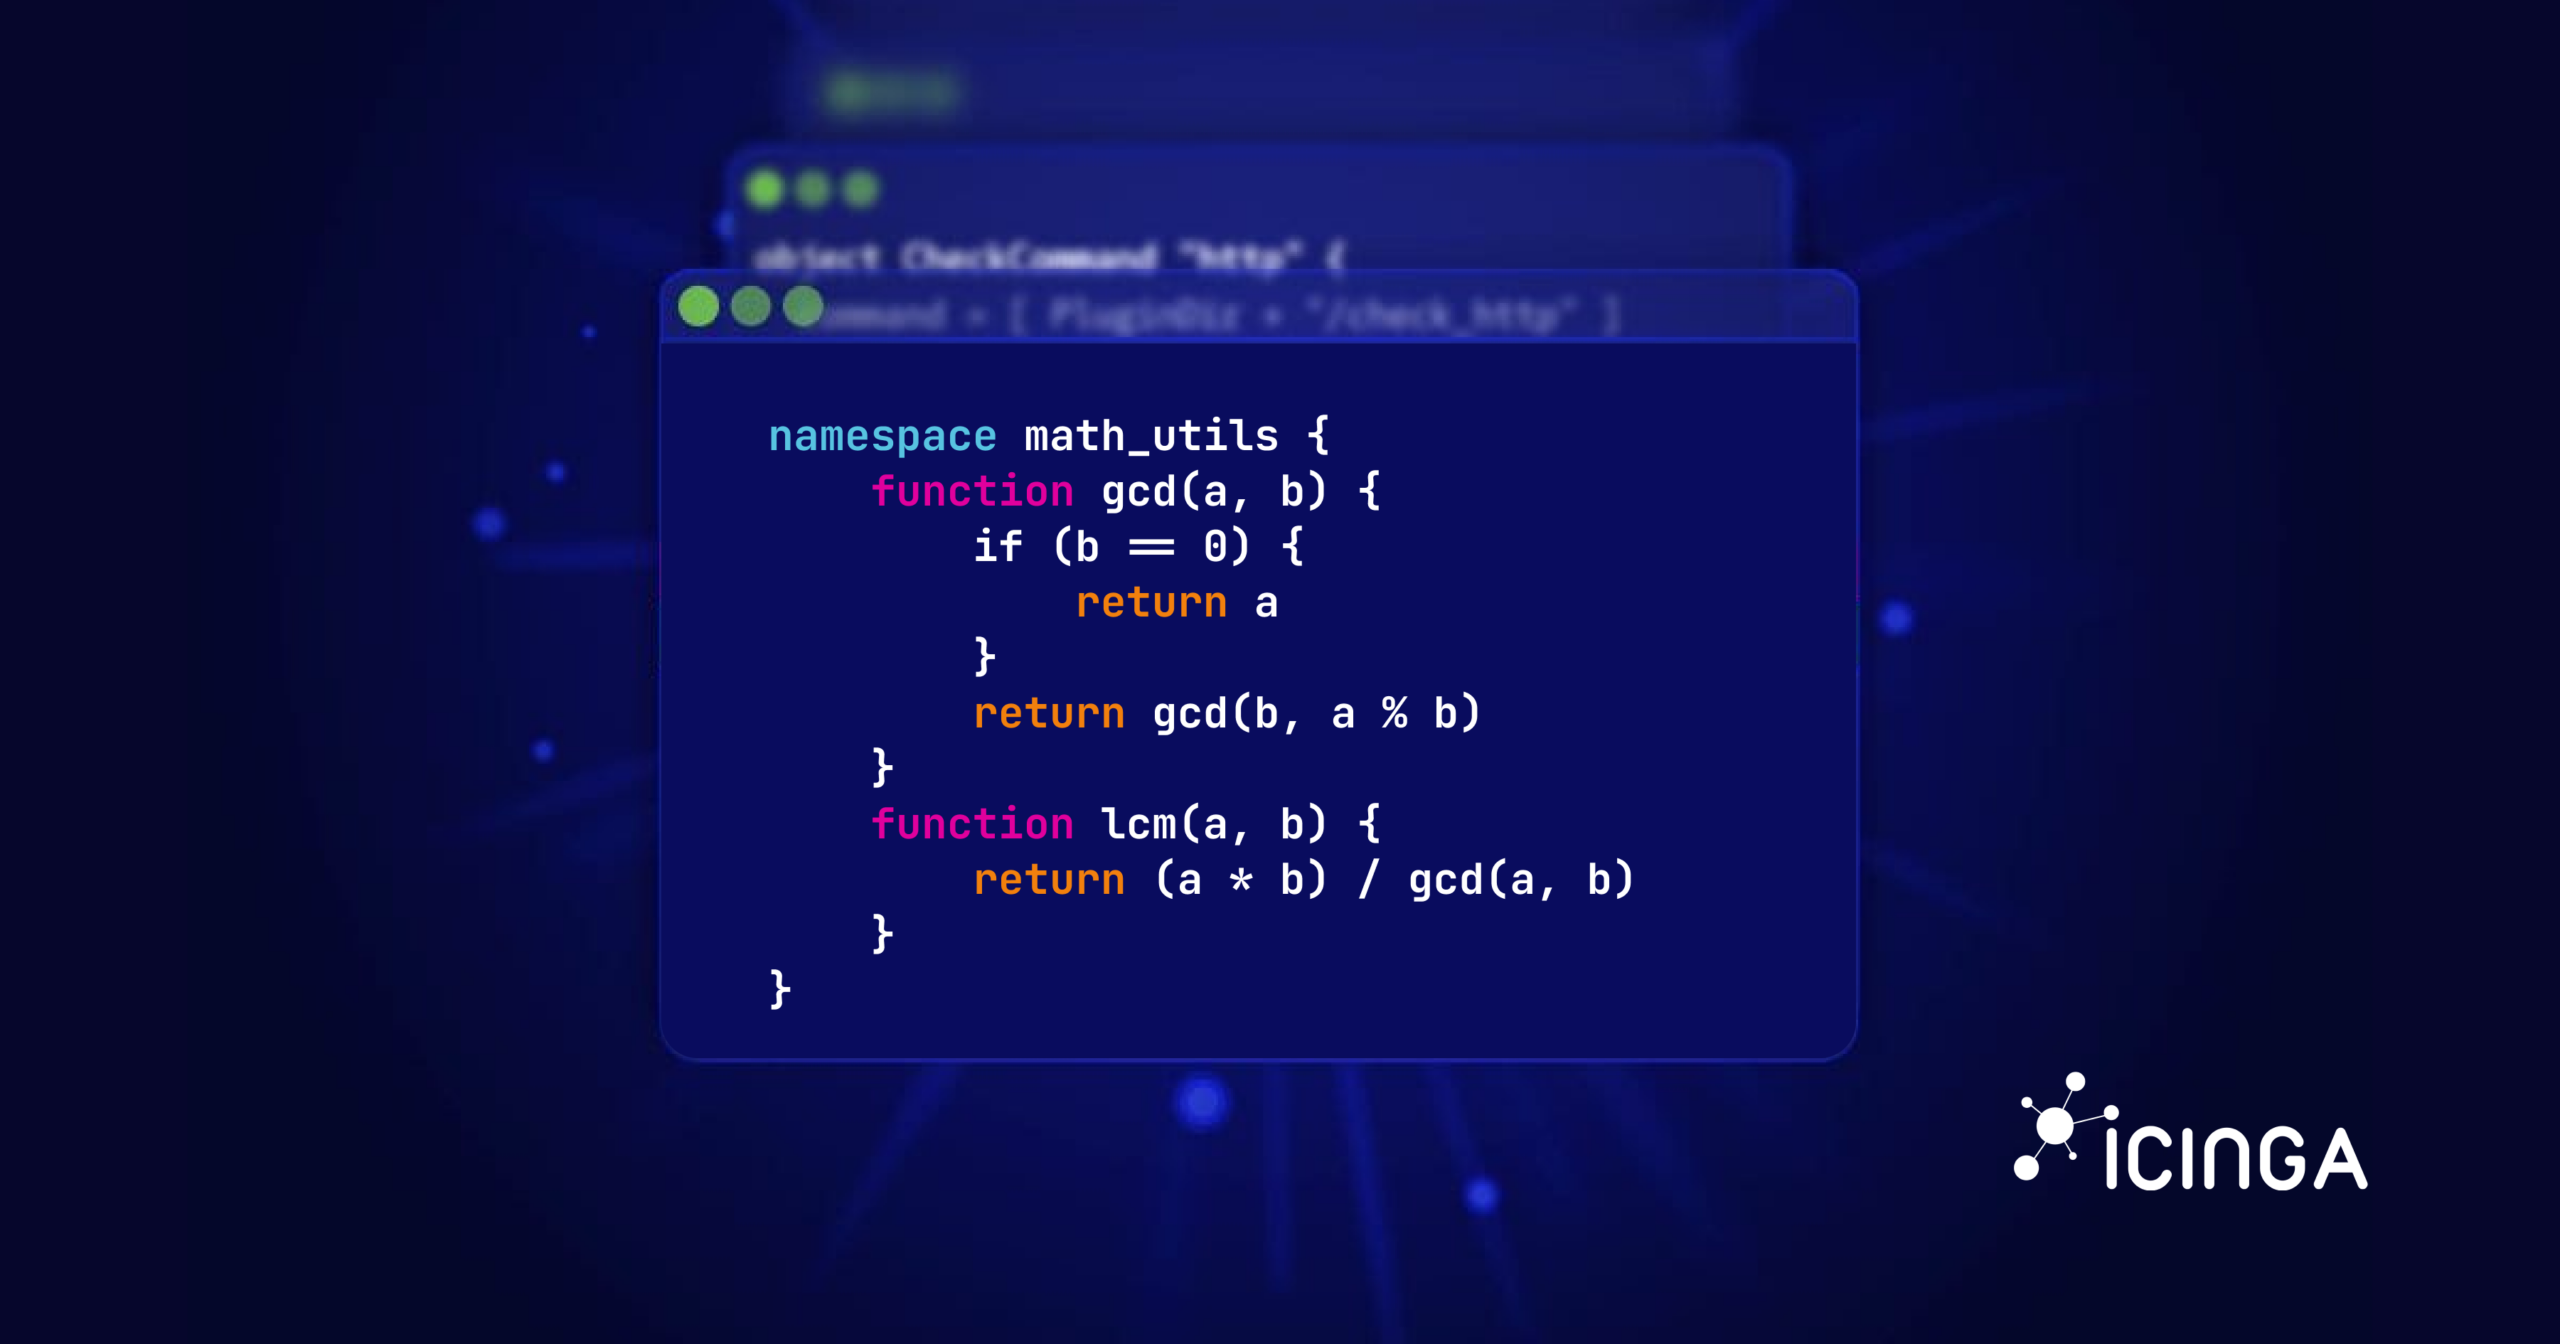
Understanding Namespaces in Icinga 2 DSL
Last time, we explored the concept of variable scopes in Icinga 2, which help you manage and organize your DSL configurations effectively. As promised, today we'll dive into another, how shall I say, advanced topic: Namespaces in Icinga 2. What are Namespaces?...
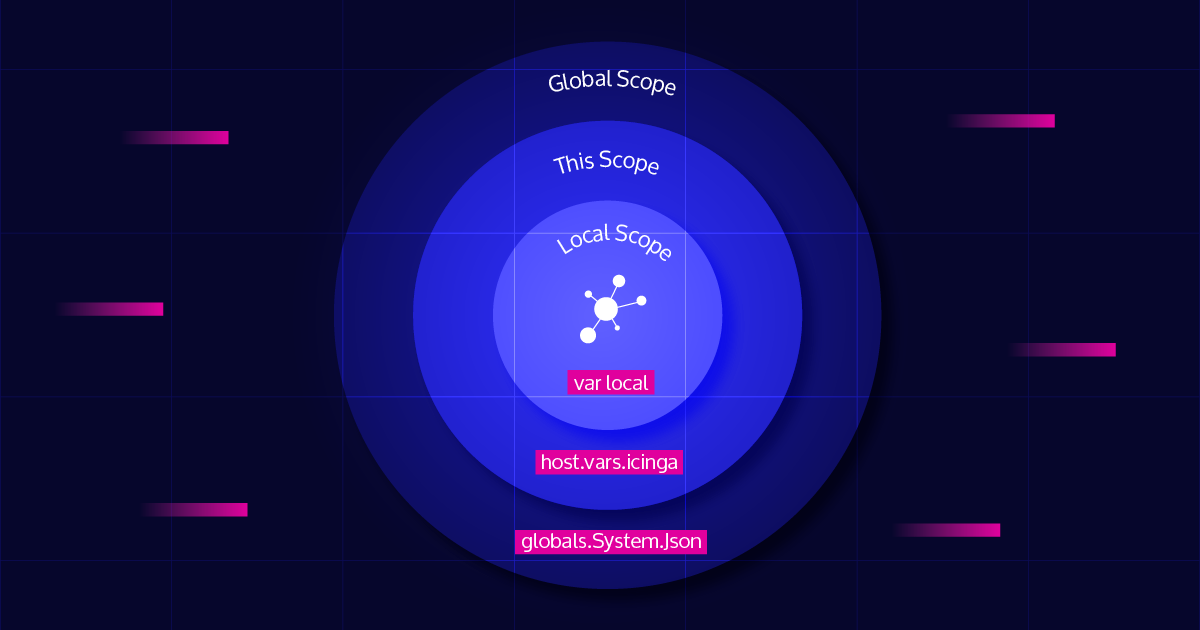
Icinga 2 DSL – Variable Scopes
Ever wondered how Icinga 2 manages all those variables, and how it knows which one to use? In this blog post, we will explore all the different variable scopes in Icinga 2, and by the end, you will know what this mysterious error message means when you see it in your...
Hybrid IT Infrastructure Management
Introduction Today’s IT environments are rarely confined to a single data center or a single cloud provider. Enterprises are embracing a mix of cloud platforms, virtual machines, and on-premises hardware to stay agile and competitive. This blended environment is known...
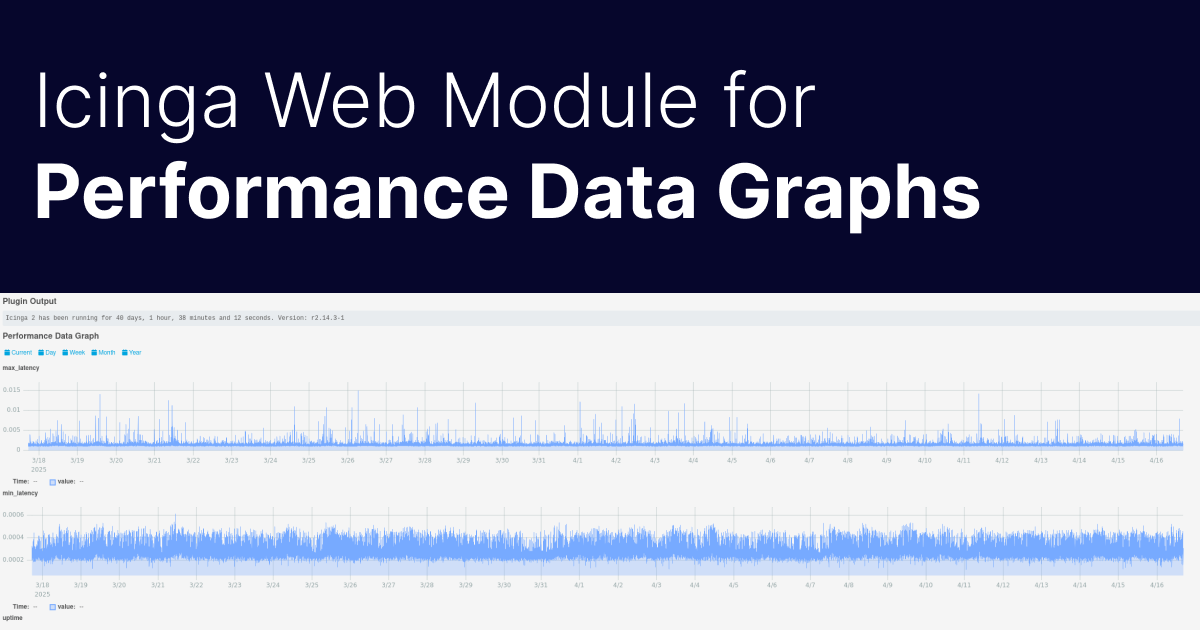
How to Add Performance Data Graphs into Your Icinga Instance
This is a guest blogpost by Markus Opolka from the Icinga Enterprise Partner NETWAYS. After forking the Grafana Module for Icinga Web last year, we started thinking about alternative ways to display Icinga performance data graphically in the web interface....
Critical Icinga 2 Security Releases: 2.14.6, 2.13.12, 2.12.12 (CVE-2025-48057)
Today, we are releasing security updates for Icinga 2 fixing a critical vulnerability that allowed an attacker to obtain valid certificates from the Icinga CA under certain circumstances. Please note that if Icinga 2 is built with OpenSSL 1.1.0 (released in 2016) or...
Ownership change of the ansible-collection-icinga to NETWAYS
After NETWAYS has already taken a leading role in the past in maintaining the Ansible Collection Icinga, contributing features and bug fixes, it’s now official: The Ansible Collection Icinga is moving into the NETWAYS namespace (on GitHub and Ansible Galaxy). The...
Announcing Icinga for Kubernetes v0.3.0
We’re excited to share that Icinga for Kubernetes v0.3.0 is here! This release is packed with features designed to make monitoring your Kubernetes environments smoother, smarter, and more efficient. Let’s take a closer look at what’s new: Monitor Multiple...
Observability vs Monitoring: Enhancing, Not Replacing
In the dynamic world of IT operations, a common misconception has emerged: Observability vs Monitoring is often framed as a battle where one replaces the other. At Icinga, where open-source monitoring is our expertise, we aim to clarify this misunderstanding....
Investment Trends in Infrastructure Monitoring Market: What Users Should Know
In recent months, the IT monitoring landscape has seen notable investment activity: Turn/River Capital acquired SolarWinds. The same firm previously invested in Paessler (PRTG). Checkmk announced a strategic investment from PSG. These developments are part of a larger...
Releasing Icinga for Windows v1.13.3
Today we are happy to announce that - after a long bugfixing session - we released Icinga for Windows v1.13.3. This release ships with a new PowerShell Framework (v1.13.3) and PowerShell Plugins (v1.13.1). Breaking Change for Scheduled-Task plugin With Icinga for...

Subscribe to our Newsletter
A monthly digest of the latest Icinga news, releases, articles and community topics.
