Icinga Insiders: How User Research Shapes the Future of Icinga Web Icinga Insiders is one of our core initiatives for involving users directly in the ongoing development of Icinga Web, its modules,...
Icinga Insiders: Collaborating With Users to Improve Icinga Web
Icinga Insiders: How User Research Shapes the Future of Icinga Web Icinga Insiders is one of our core initiatives for involving users directly in the ongoing development of Icinga Web, its modules,...
Upgrade your monitoring lists with icon images
Recently I was importing an Icinga configuration for testing purposes. Working with this configuration, I found that there were icon images assigned to the objects. Sadly, those didn’t display, because I didn’t have the icon set installed. So I thought of creating my...
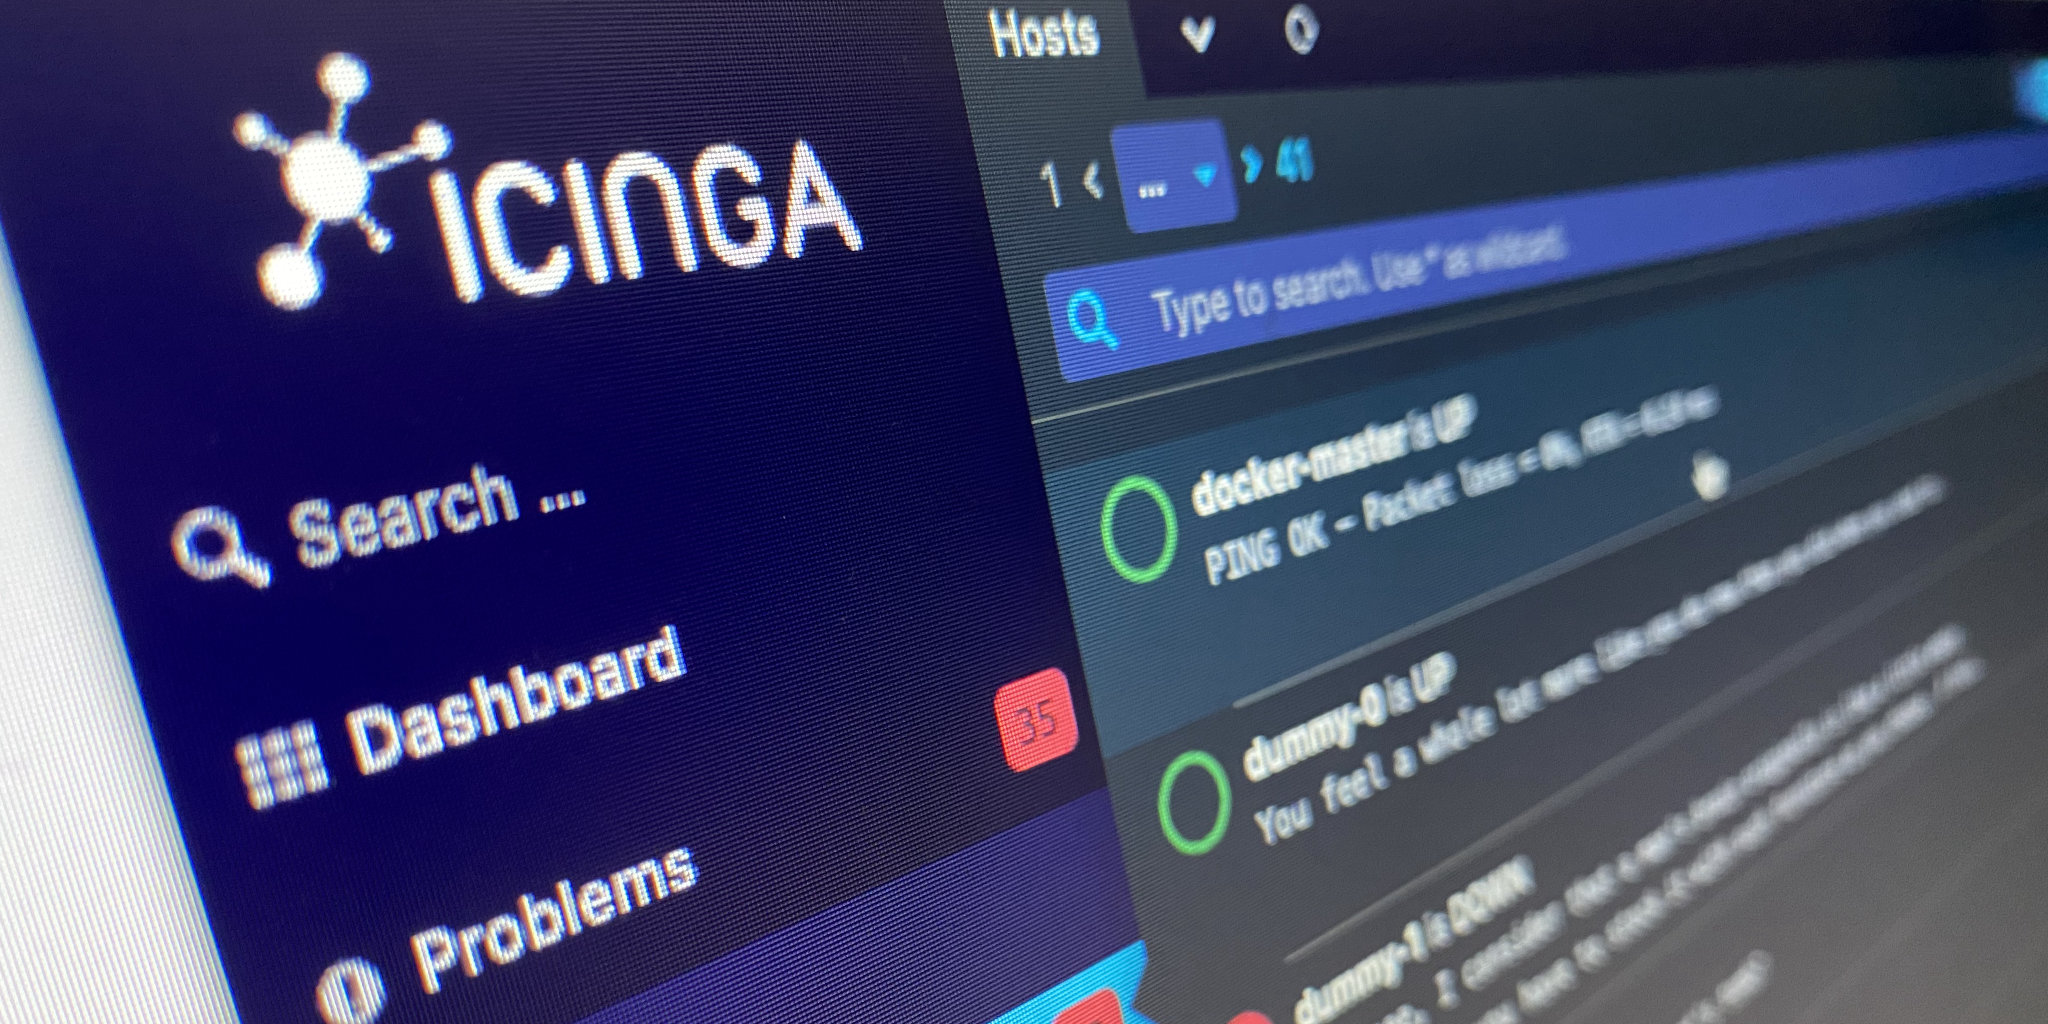
How Quick User Tests Help Us Make Better UI Decisions in Icinga Web
Designing user interfaces for Icinga Web is always a bit of a balancing act. Once we’ve worked through all the technical and conceptual details of a new feature, it can be tough to step back and see things from a fresh user’s point of view. We as developers know too...
Polishing the Icinga DB Web User Interface
When redesigning the new Icinga DB Web interface elements we already started establishing consistent design elements. This is even more supported by developing the Icinga PHP Library (IPL) from the ground up. IPL makes developing reusable widgets a lot easier for...
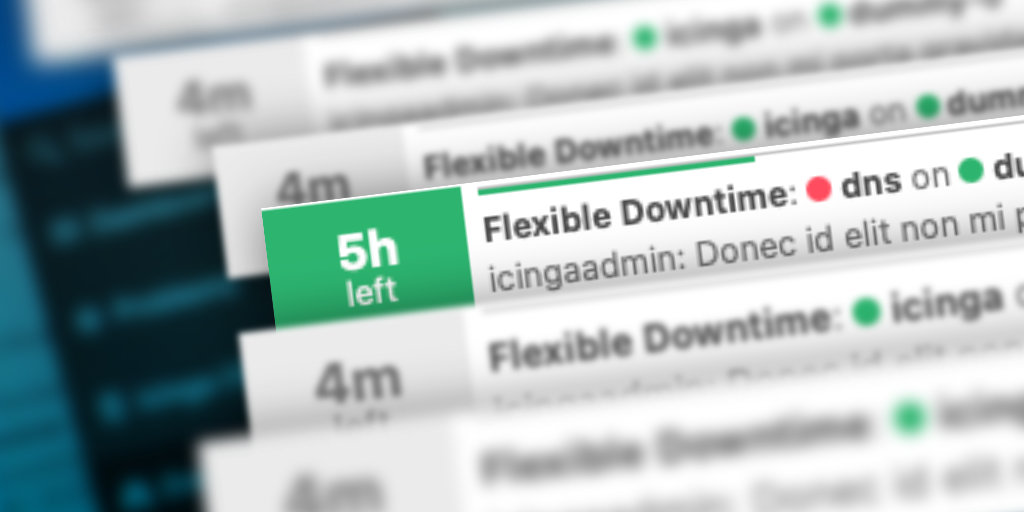
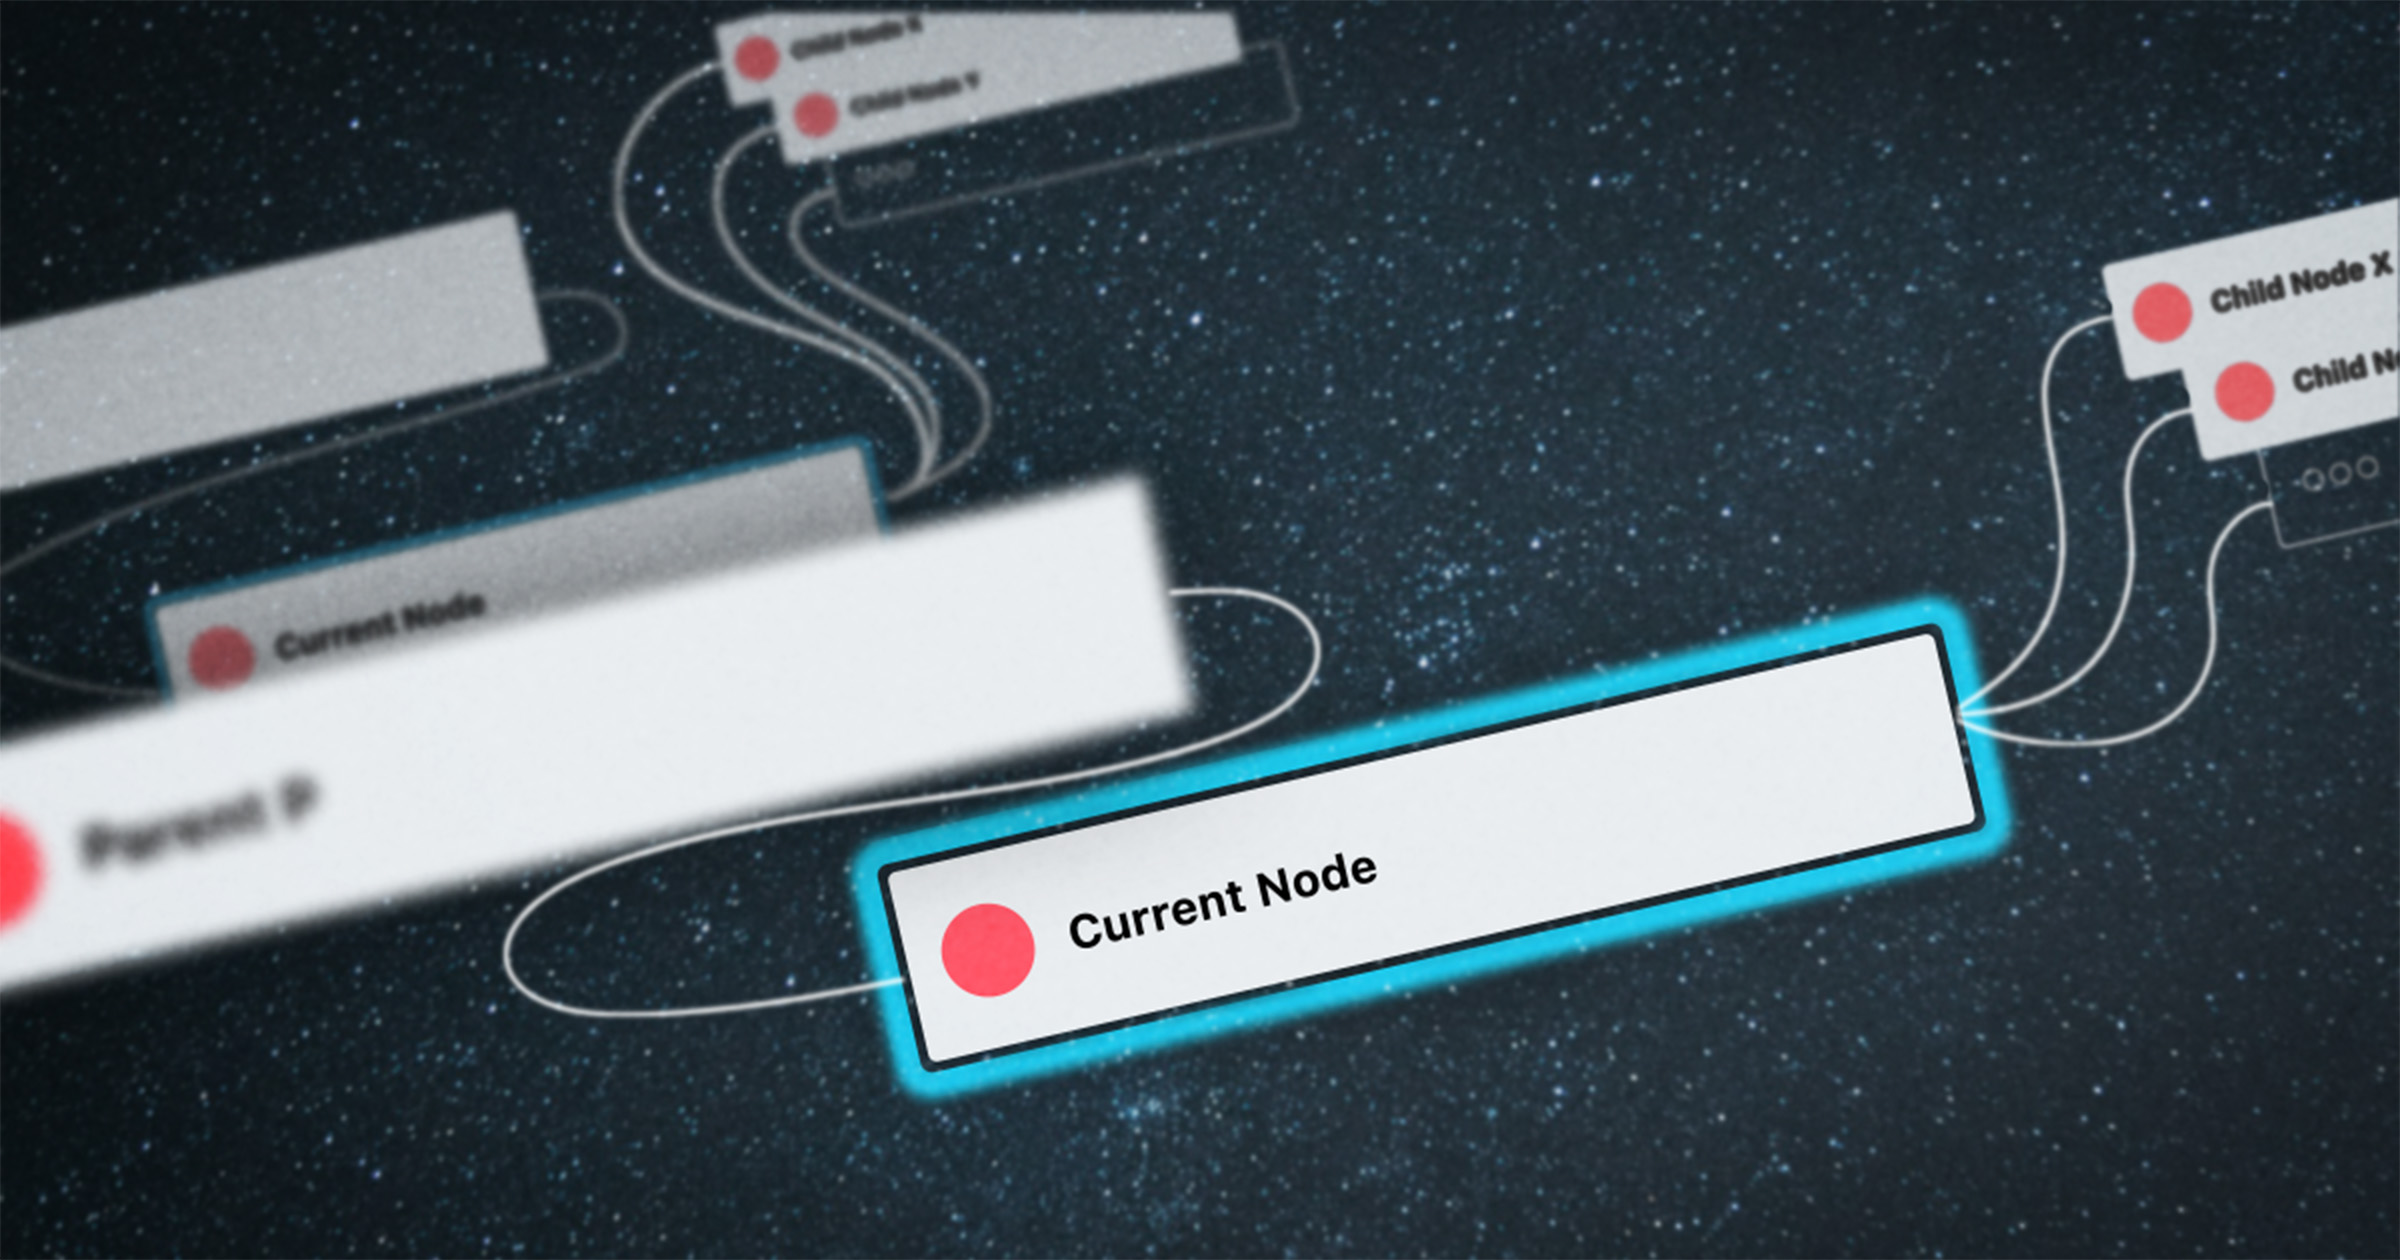
How downtimes are displayed in Icinga DB Web
With the development of Icinga DB we not only rebuilt the core of how Icinga stores and reads monitoring data. With a complete rebuild of the monitoring module we took the chance and refined most aspects of the user interface as well. One aspect that got attention is...

Introducing the redesigned Check Statistics widget
Those of you, who’ve already tried out the Web Interface for Icinga DB might have noticed the redesigned layout of the check execution statistics section in a monitoring object’s detail view. For all the others: Learn about it in this post. On first hand we wanted to...

Subscribe to our Newsletter
A monthly digest of the latest Icinga news, releases, articles and community topics.
