We are excited to announce the release of Icinga for Kubernetes v0.2.0! This update brings a host of new features and improvements that enhance our monitoring solution for Kubernetes. It makes it easier than ever to analyze problems and understand complex Kubernetes hierarchies.
Vision and Roadmap
Although every Kubernetes cluster is different, Icinga for Kubernetes aims to provide a zero-configuration baseline for monitoring Kubernetes. Our goal is to make it easy to understand the complete state of clusters, including resources, workloads, relations, and performance. We strive to offer comprehensive monitoring that provides a clear and intuitive view of clusters’ health, helping to identify problems and potential bottlenecks.
The Kubernetes API is leveraged to retrieve information about resources and watch ongoing changes. This data is stored in a database to reduce pressure on the Kubernetes API and to enable powerful filtering through a relational model.
Currently, Icinga for Kubernetes utilizes all available information from the Kubernetes API to determine the state of resources and clusters. In future versions, we plan to integrate metrics. Upcoming features will also include the use of Icinga Notifications for sending alerts and supporting multiple clusters.
We welcome your ideas on what should be included in the baseline. Do not hesitate to share your key metrics, important thresholds, or correlations used to set up alarms in your environments by opening an issue on our Icinga for Kubernetes GitHub repository.
What’s New in v0.2.0?
Refreshed, Streamlined UI
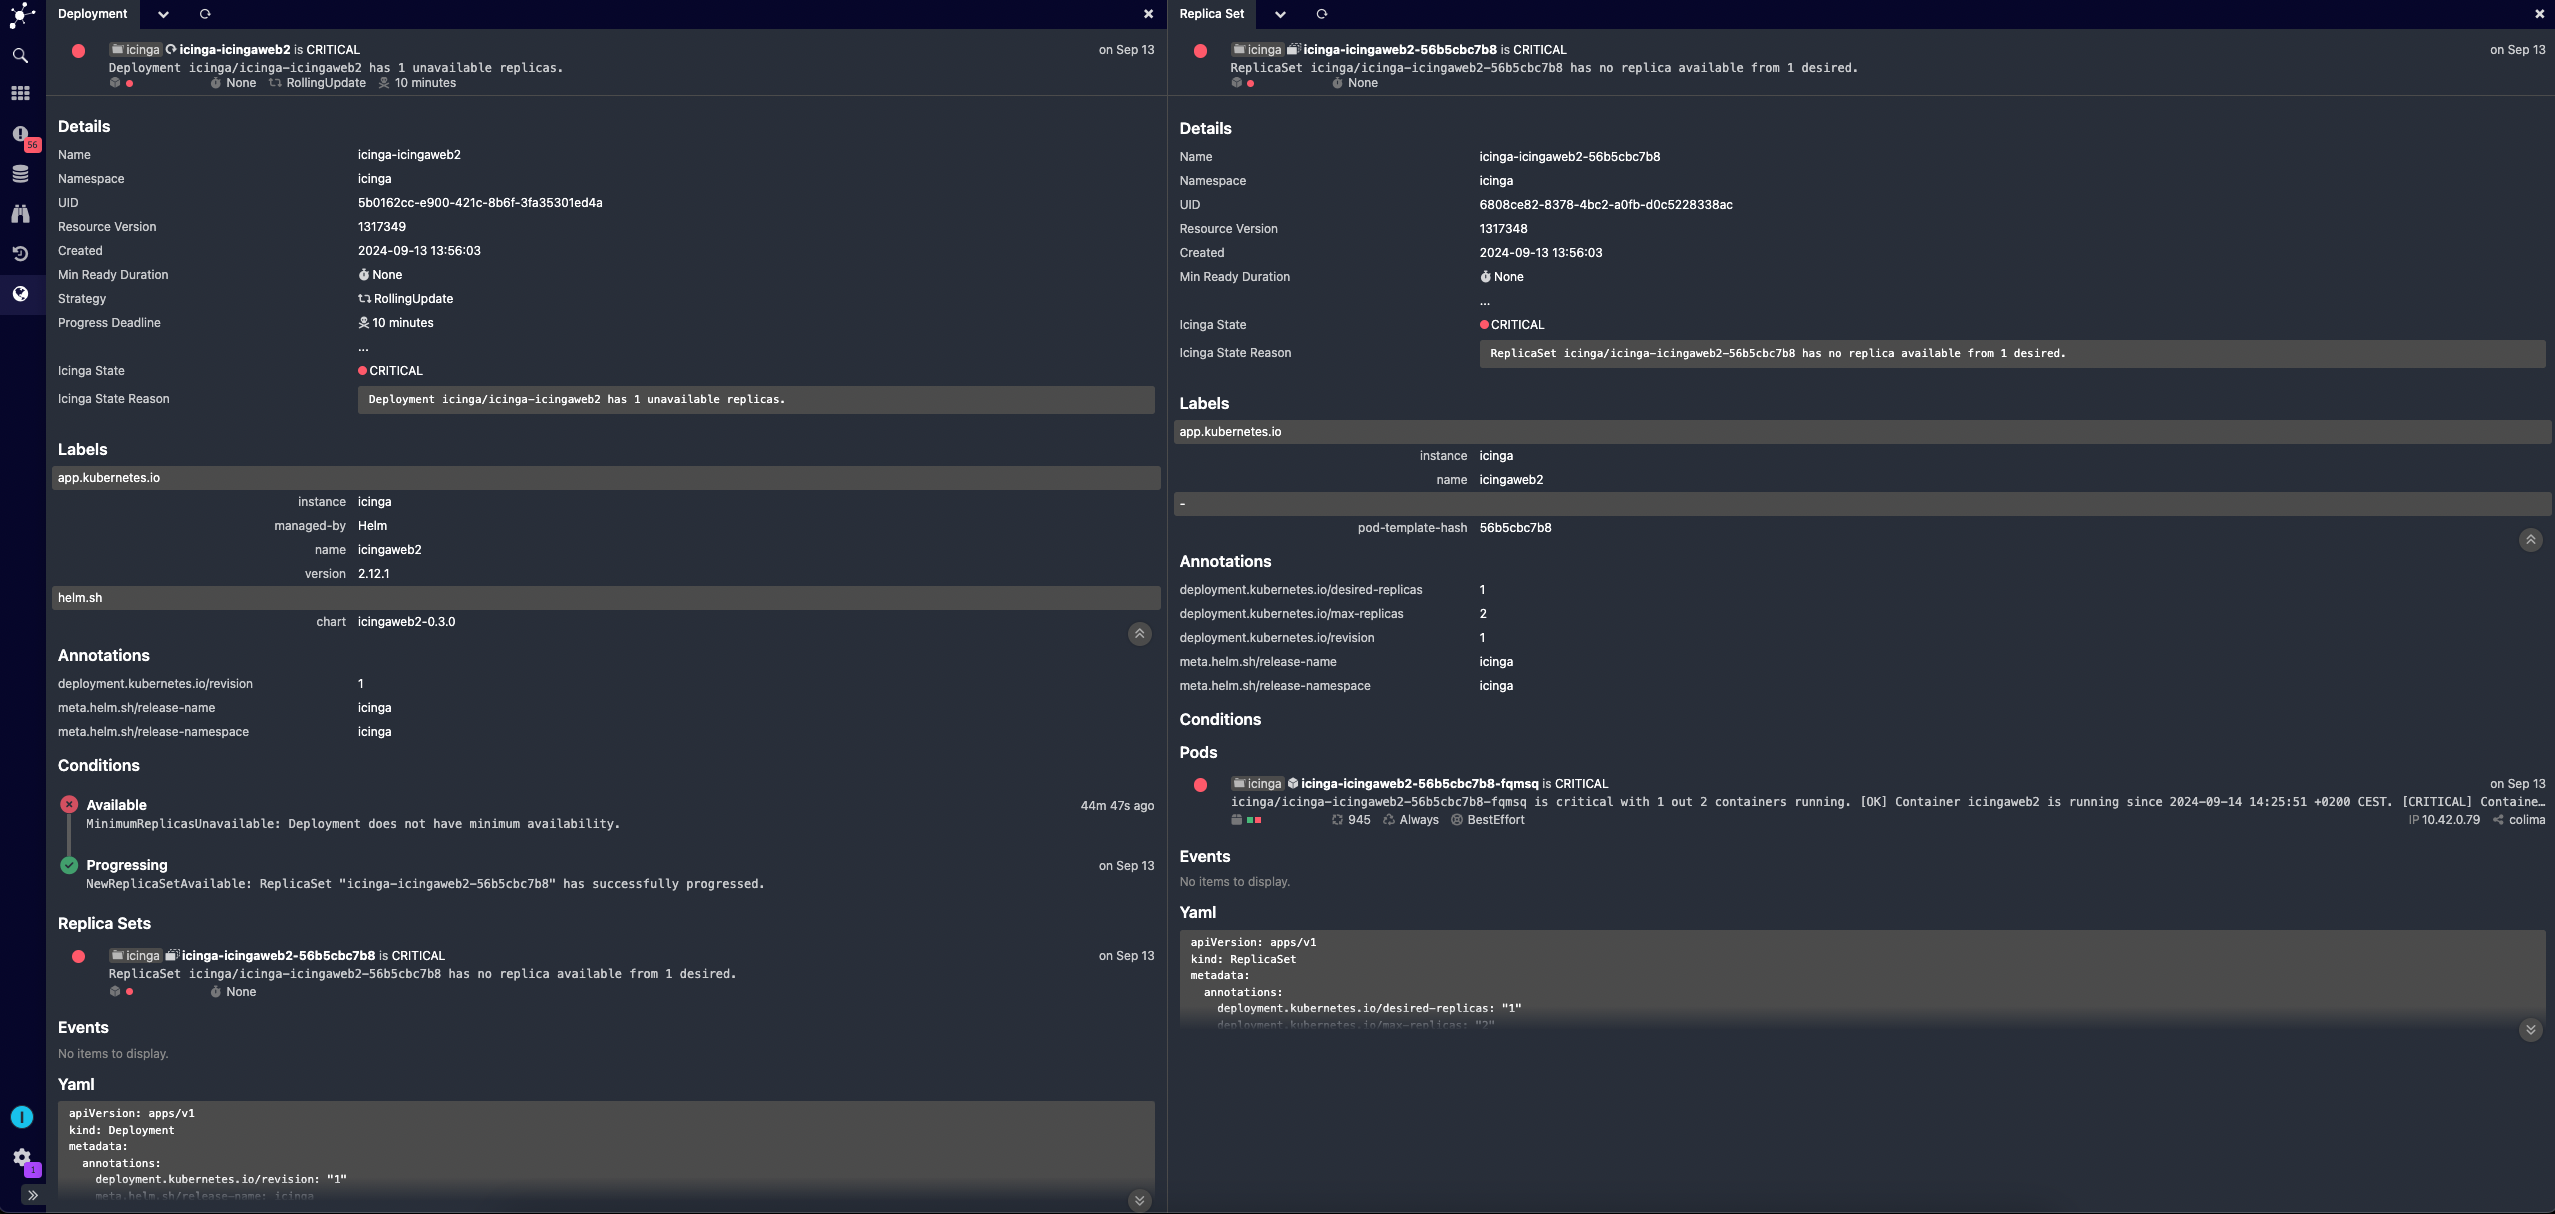
Therefore, we’ve listened to your feedback and implemented a refreshed, streamlined user interface. It makes navigating Icinga for Kubernetes more intuitive. The updated design not only enhances the aesthetic appeal but also improves usability. As a result, this allows you to find and act on critical information faster. Overall, the new UI aligns with modern design principles, making your monitoring experience smoother and more enjoyable.
Icinga States
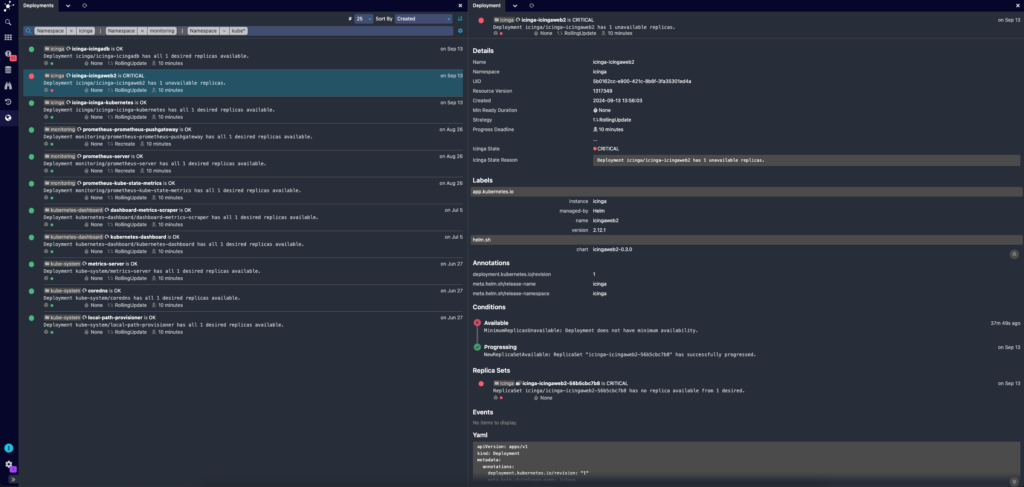
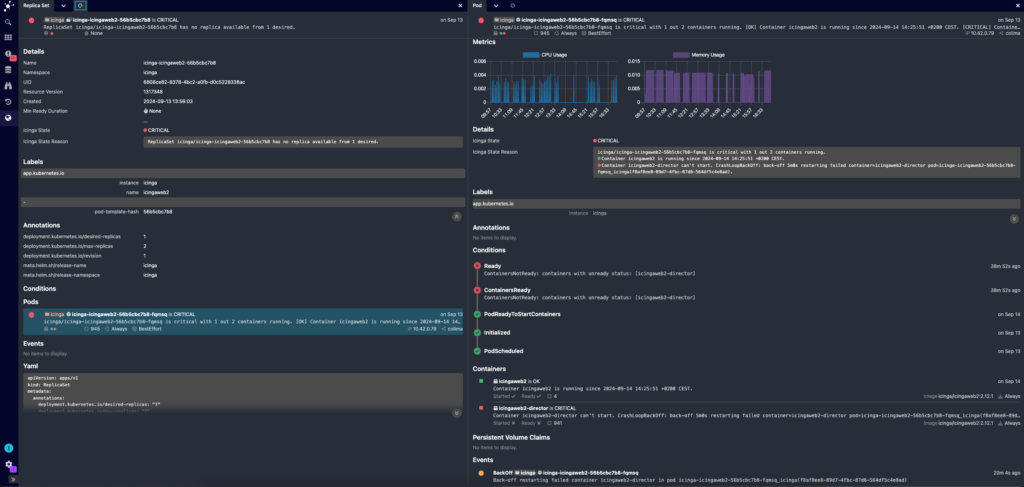
Understanding the health of your Kubernetes environment is now easier with the new Icinga States feature. This addition provides a clear overview of the state of your resources, categorizing them into healthy, warning, or critical states. It achieves this by correlating container and pod states and conditions, helping to determine the actual state of a Kubernetes resource. As a result, this provides a clearer picture of your cluster’s health and simplifies troubleshooting. With this comprehensive view, you can quickly spot issues that need your attention. Additionally, you can drill down into the details to address them efficiently.
Annotations Synchronization
Annotations are now synchronized and displayed in the web interface, providing more context and filtering possibilities. This enhancement allows you to leverage Kubernetes annotations directly within Icinga. Consequently, it is easier to organize and manage your resources.
View YAML of Kubernetes Resources
You can now view the YAML configuration of Kubernetes resources directly from the web interface. Therefore, this feature makes it easier to inspect and debug resource definitions without leaving the monitoring environment.
Metric Charts
Icinga for Kubernetes v0.2.0 introduces Metric Charts that allow you to visualize essential metrics right from the dashboard. Whether it’s CPU usage, or memory consumption, these charts give you an at-a-glance view of your cluster’s performance. Consequently, this new feature helps in quickly identifying trends and potential bottlenecks, enabling proactive management of your resources.
Container Log Limitation
To optimize performance and prevent excessive log data from overwhelming your system, we have limited container log length.
Get Started or Upgrade
To upgrade to Icinga for Kubernetes v0.2.0, you will need to update your packages, containers, or Helm charts. It depends on your installation method. Schema changes will be deployed automatically after the upgrade.
If you haven’t installed Icinga for Kubernetes yet, here’s how to get started:
Any of the Icinga for Kubernetes components can run either inside or outside Kubernetes clusters, including the database. For running Icinga within Kubernetes, use our Helm charts to provide a ready-to-use Icinga stack:
helm repo add icinga https://icinga.github.io/helm-charts
helm repo update
kubectl create namespace icinga
helm install icinga-stack \
--namespace icinga \
--set icinga2.config.ticket_salt.value=CHANGE-ME \
--set icingaweb2.auth.admin_password.value=CHANGE-ME \
--set global.api.users.director.password.value=CHANGE-ME \
--set global.api.users.icingaweb.password.value=CHANGE-ME \
--set global.databases.director.username.value=CHANGE-ME \
--set global.databases.director.password.value=CHANGE-ME \
--set global.databases.icingaweb2.username.value=CHANGE-ME \
--set global.databases.icingaweb2.password.value=CHANGE-ME \
--set global.databases.icingadb.username.value=CHANGE-ME \
--set global.databases.icingadb.password.value=CHANGE-ME \
--set global.databases.kubernetes.username.value=CHANGE-ME \
--set global.databases.kubernetes.password.value=CHANGE-ME \
icinga/icinga-stack
We also provide ready-to-use packages icinga-kubernetes and icinga-kubernetes-web for various Linux distributions, for those of you who do not want to deploy Icinga for Kubernetes via Helm.
Learn More
Make sure to check out the documentation for Icinga for Kubernetes and its web interface Icinga Kubernetes Web to learn more about the architecture, installation options, and configuration.
Upgrade to Icinga for Kubernetes v0.2.0 today and experience a more streamlined and efficient monitoring solution for your Kubernetes clusters!

