Kubernetes Monitoring
Gain clear visibility over your Kubernetes clusters and on-premises environments with Icinga’s status indicators and context-driven alerts.
Challenges of Mixing On-Prem and Kubernetes Monitoring
Kubernetes environments are complex, and combining them with existing on-prem systems makes monitoring even more difficult. Tools like Prometheus provide valuable metrics, but often lack the context needed to fully understand cluster health and performance.
In hybrid infrastructures, full visibility is essential. Without a unified monitoring solution, critical issues can be missed or misunderstood.
Icinga extends Prometheus and enhances hybrid monitoring. It helps you understand infrastructure health more clearly by:
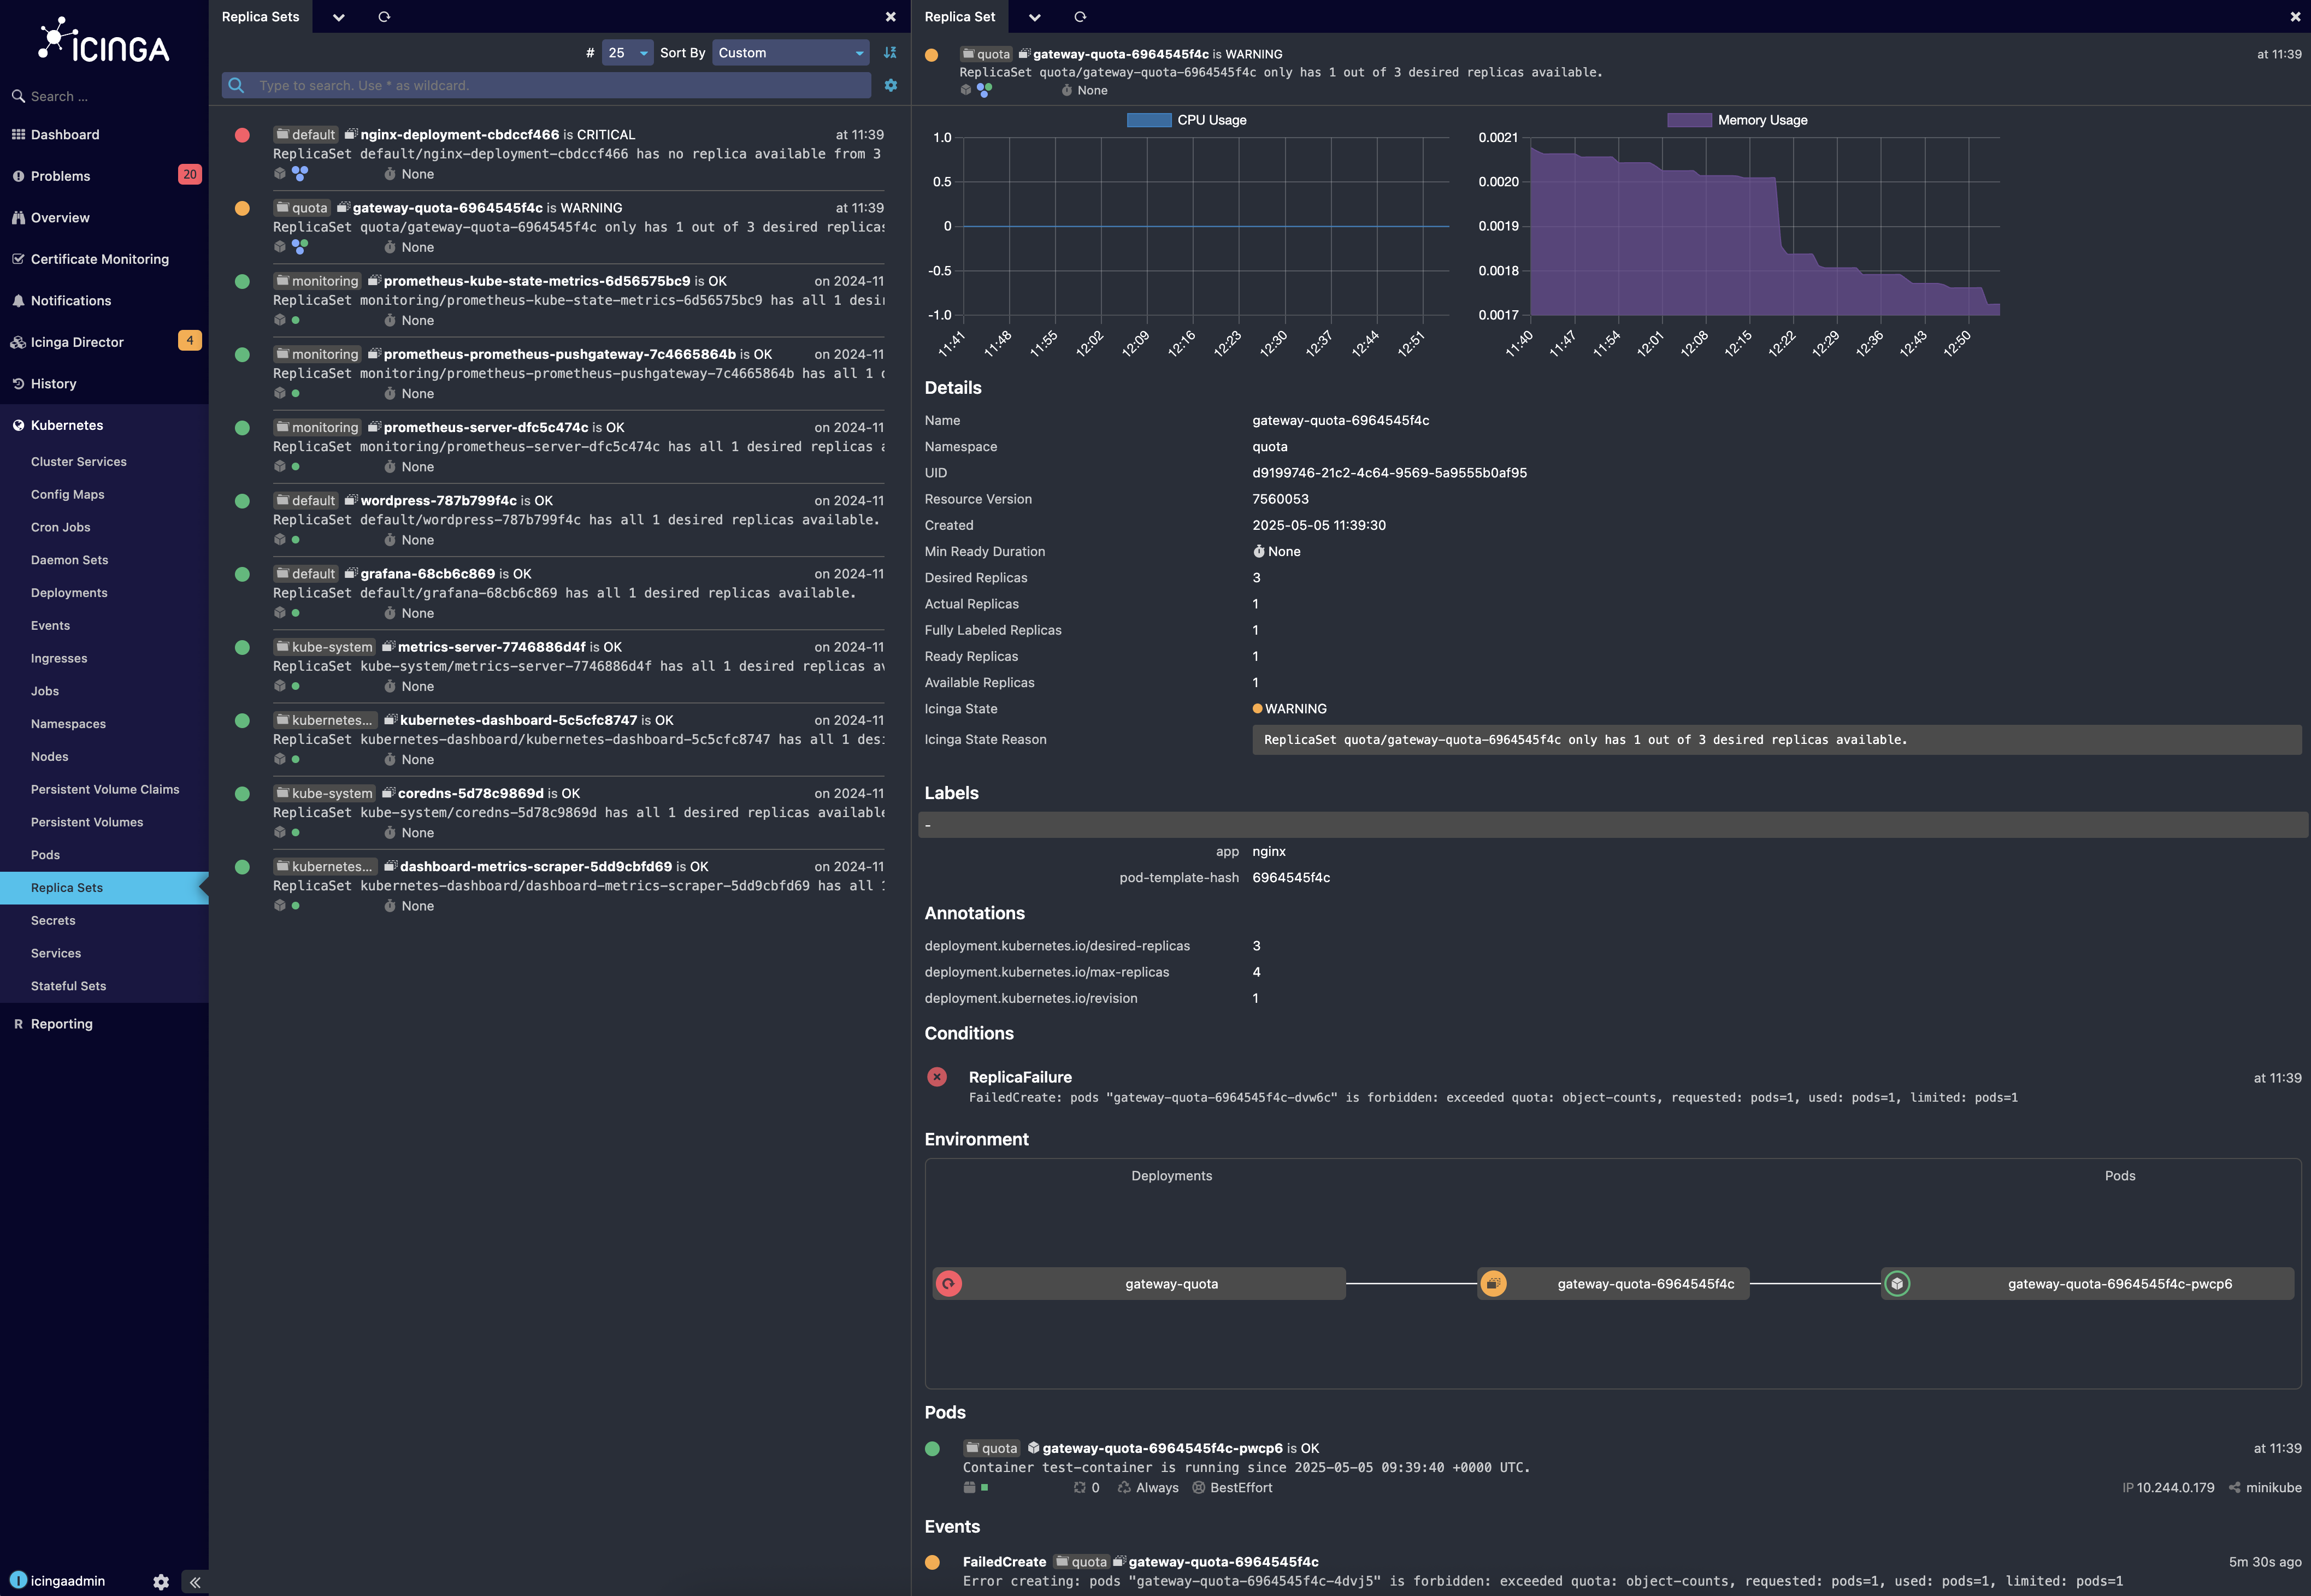
- Providing a simple, intuitive interface with clear status indicators in green, yellow and red, making Kubernetes system health visible.
- Enriching Prometheus metrics by adding context to raw data, helping you connect anomalies to their underlying causes.
- Offering a unified view of your entire environment for your multi-cluster and hybrid infrastructure monitoring.
Imagine your Kubernetes cluster suddenly stops processing requests. Prometheus shows metrics spiking, but you still don’t know what’s wrong. With Icinga, you immediately see that a specific Pod failed due to a missing volume mount. The issue is clear, and you can take action instantly.
Key Features of Icinga for Kubernetes Monitoring

Automated Discovery & State Analysis
Icinga automatically detects Kubernetes clusters and evaluates their state without complex configuration.
Intelligent Notifications & Role-Based Access Control
Receive targeted alerts that explain what’s wrong and why, simplifying troubleshooting.
Multi-Cluster & Hybrid Infrastructure Monitoring
Monitor various Kubernetes clusters and on-premises systems from one interface.
Prometheus & Grafana Integration
Prometheus collects the metrics, Grafana visualizes them and Icinga adds context, health states, and intelligent alerts.
Straightforward Installation
Deploy Icinga via Helm charts or as an external component with clear instructions.
Why Icinga Stands Out
Unlike pure Prometheus setups, Icinga provides clear insights by automatically translating raw metrics into understandable states. No more guessing why something broke. Icinga shows you the exact cause. Learn more about Icinga Notifications
Deploy. Connect. Monitor. With Icinga for Kubernetes

1. Install
Deploy Icinga for Kubernetes via Helm charts or manual setup guides. Quick and straightforward.
2. Connect via API
Automatically discover Kubernetes components and continuously collect relevant data.
3. Visualize & Alert
Monitor status and receive alerts in the Icinga Web Interface, enriched with context to simplify troubleshooting.
A Sysadmin receives a notification from Icinga: A specific Replica Set is marked as critical because it’s stuck in a restart loop. The alert explains the root cause: A faulty configuration file. With this context, the admin adjusts the file and resolves the issue quickly, without digging through logs or running multiple CLI commands.
Extending Prometheus and Grafana
Prometheus & Grafana Integration
Prometheus collects metrics, Grafana visualizes them and Icinga adds context, health states, and smart alerts.
Icinga Notifications
Receive notifications enriched with contextual information, making them more valuable than simple metric alerts.
Multi-Cluster Monitoring
Monitor multiple clusters across environments from one central interface.

Learn how to monitor Kubernetes with Icinga easily
You will have a deep dive into:
- Managing hybrid infrastructure (cloud + on-prem)
- Icinga’s role in the Kubernetes monitoring ecosystem
- Key features of the Kubernetes module
- Live demo: setup and integration
- Q&A to help with your specific use case
Frequently Asked Questions about Icinga for Kubernetes
What makes Icinga for Kubernetes different from Prometheus?
Icinga for Kubernetes doesn’t aim to replace Prometheus but rather complements it. While Prometheus provides extensive metrics, Icinga offers context. Instead of just showing that something went wrong, Icinga shows you why it went wrong with clear status indicators (Green, Yellow, Red) and context-rich insights.
Can I use Icinga for Kubernetes to monitor both Kubernetes clusters and on-premises infrastructure?
How does Icinga handle Kubernetes monitoring without replacing Prometheus?
Icinga integrates with Prometheus to enhance its capabilities rather than replace them. By transforming raw metrics from Kubernetes into actionable alerts and visual insights, Icinga provides more clarity and less noise, making it easier to identify root causes of issues.
What are the key benefits of Icinga’s status indicators (Green, Yellow, Red)?
Can I monitor multiple Kubernetes clusters with Icinga?
How do I get alerts from Icinga for Kubernetes?
With Icinga you can create intelligent notifications based on your individual configuration. Instead of alerting you about every small metric fluctuation, it focuses on the overall health and status of your infrastructure. Alerts are enriched with contextual information, so you immediately understand what’s wrong and why.
