Icinga – The Open Source Monitoring Solution for Enterprises
Your All-In-One Monitoring Tool for Complete Control
Stay in control of your IT infrastructure with a open-source monitoring tool designed to adapt to your complex environment. Detect issues before they cause outages, streamline your workflows, and ensure maximum uptime and performance.
Why Teams trust Icinga for IT Monitoring
Modern IT environments are complex. You are expected to ensure everything runs smoothly, 24/7. Juggling various monitoring tools or drowning in irrelevant alerts can make your job frustrating. Icinga provides a centralized view of all your infrastructure components, from networks to applications, giving you peace of mind and the ability to prevent downtime before it even starts.

Complete Visibility
Monitor networks, servers, cloud and containers in real time, all from one interface.

Highly Scalable
Grow your monitoring setup effortlessly, from a single instance to enterprise-grade deployments.

Open Source & Flexible
Customize and extend monitoring with powerful integrations and APIs.
How Icinga Empowers your IT Team to Stay Ahead of Issues
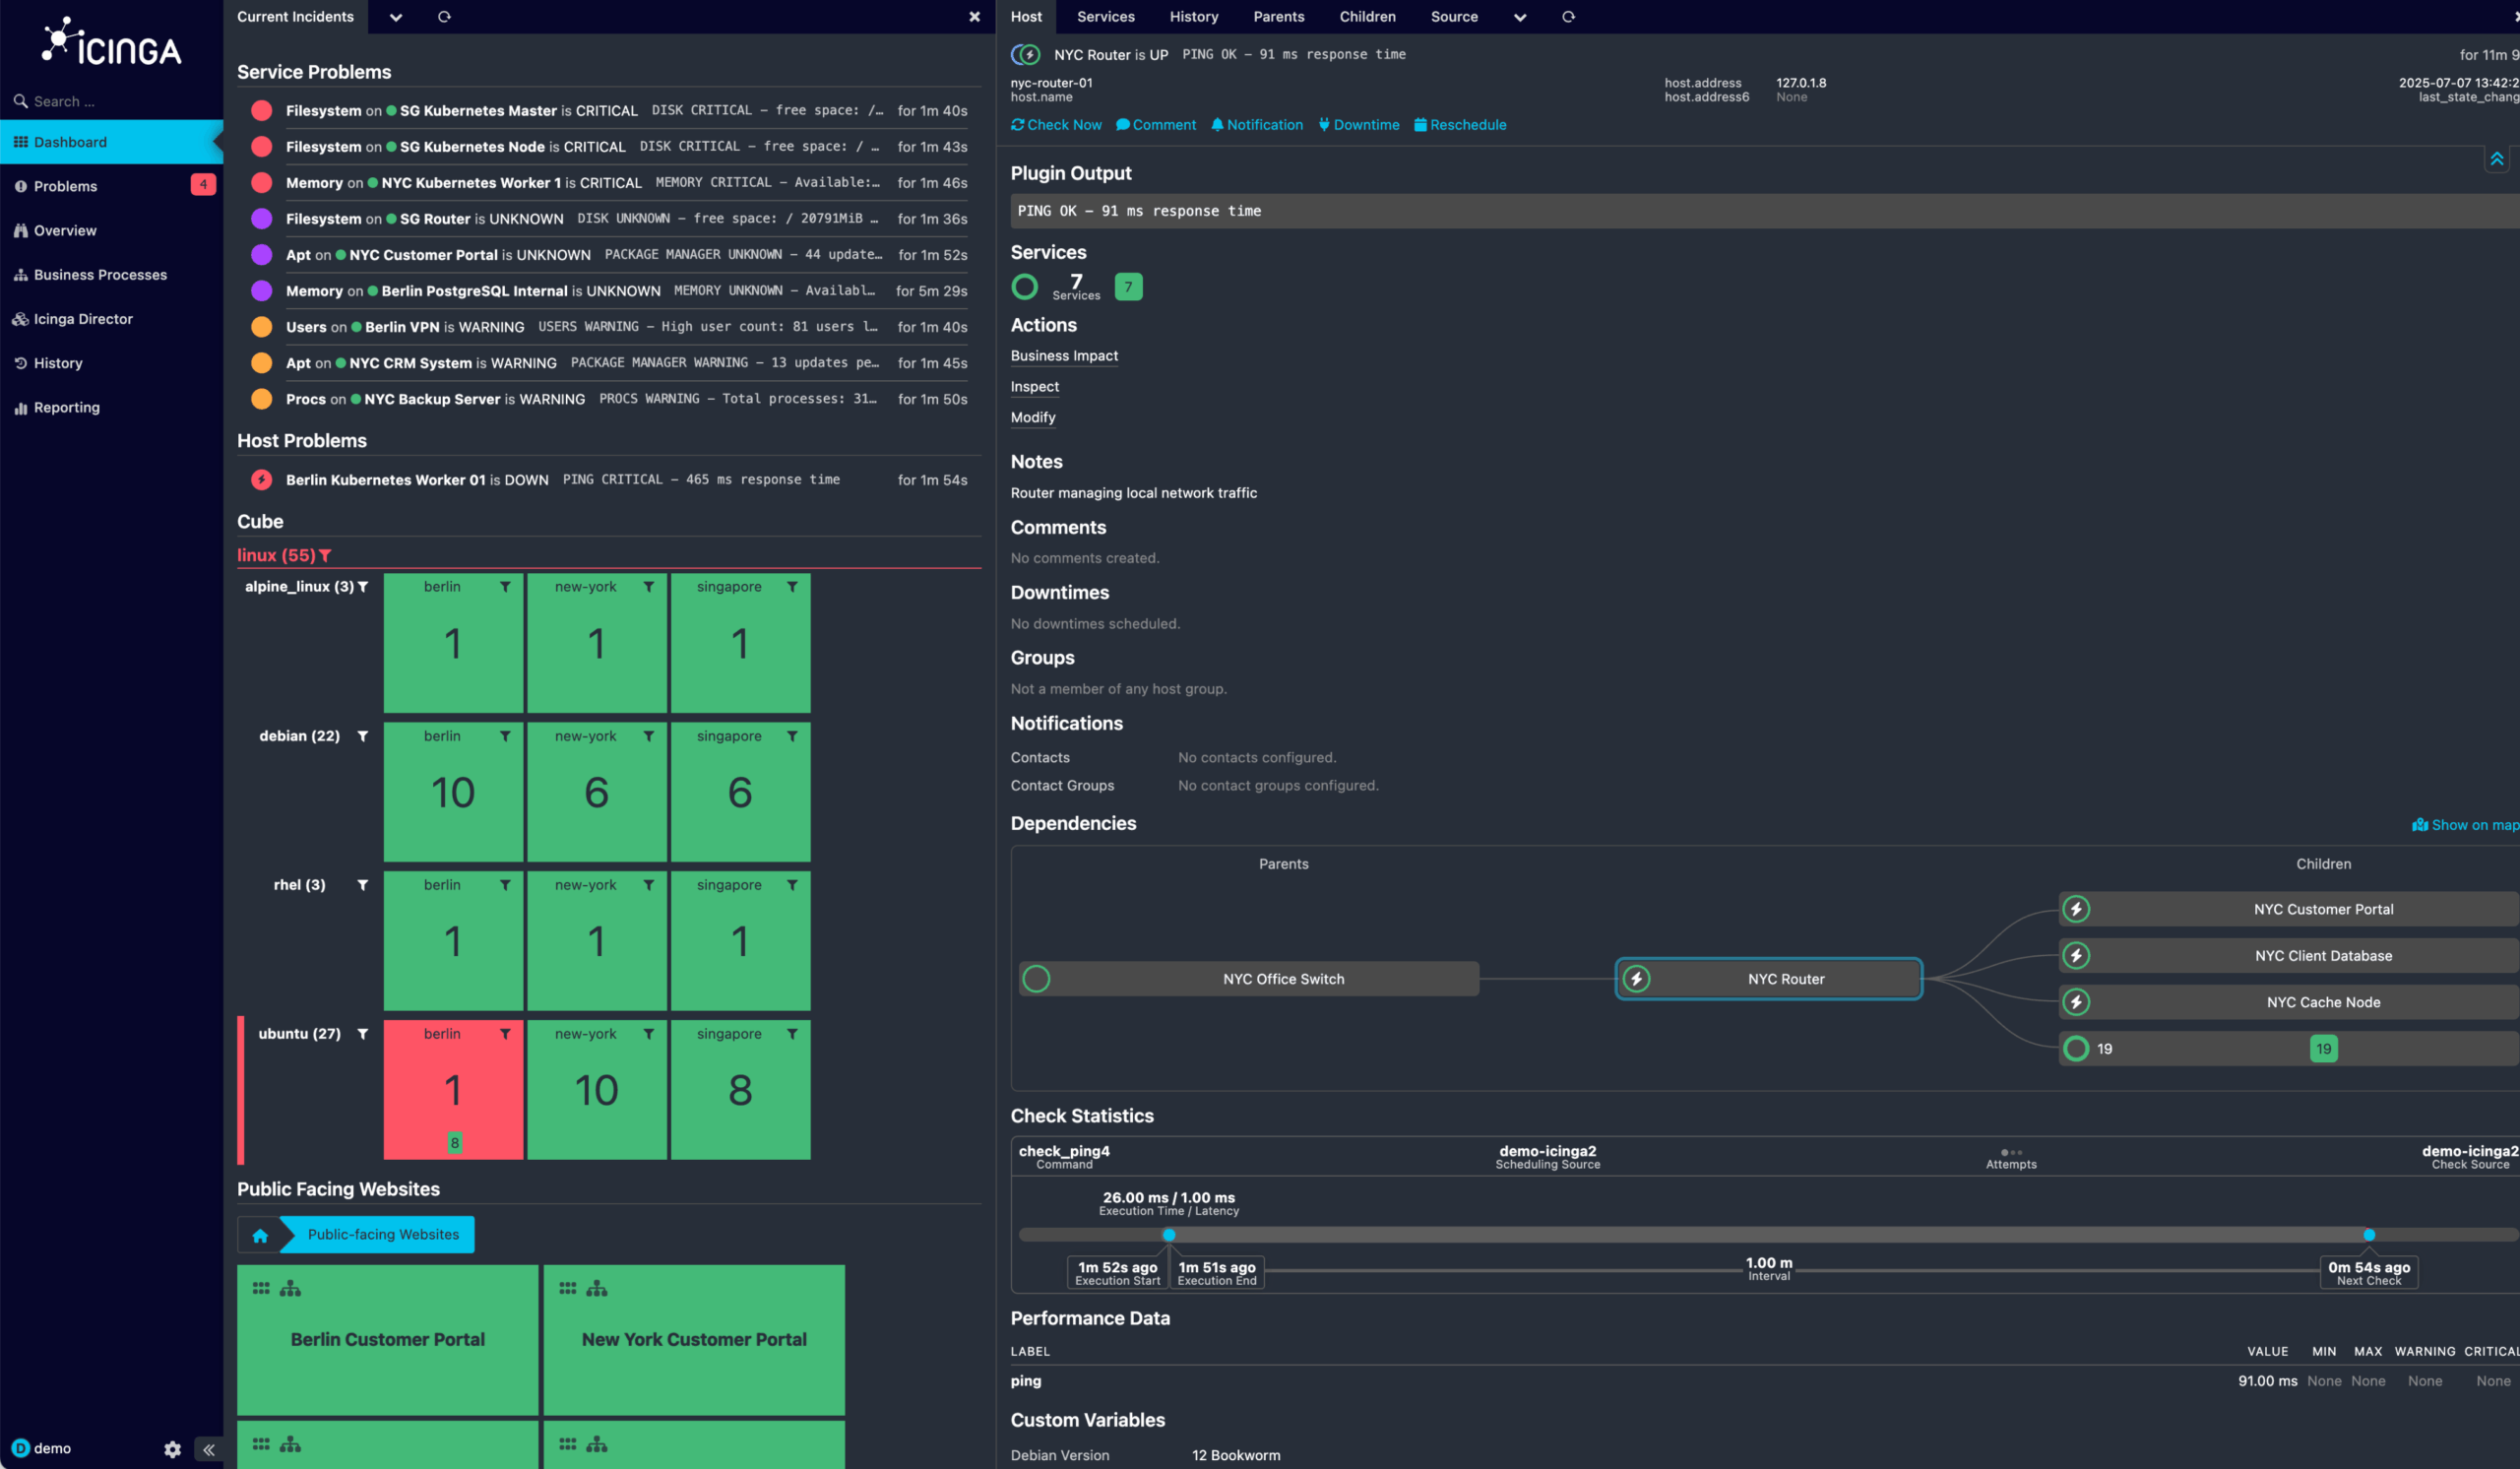
Icinga can be connected to directory services such as Active Directory and offers full multi-client capability.
Get a quick overview of whether a check is OK or whether problems have been found.
Quick access to various interactions such as setting downtimes, re-scheduling checks, creating comments or acknowledging problems.
When clicking on elements, their details open on the right-hand side and allows you to quickly jump between views.
Icinga indicates in the navigation menu when modules report information, warnings or problems.
The list view helps you detect quickly whether there are any current problems.
The navigation bar can be extended with custom items for filtered views or external links.
Quickly evaluate when a check was executed the last time, how long it took and when it will be executed again.
Describe your hosts and services with custom variables. Use them to create dynamic rules for monitoring and alering.
Find the root cause of a problem quickly with the visualization of dependencies.
Dashboard Overview
Comprehensive metrics and real-time data at a glance.
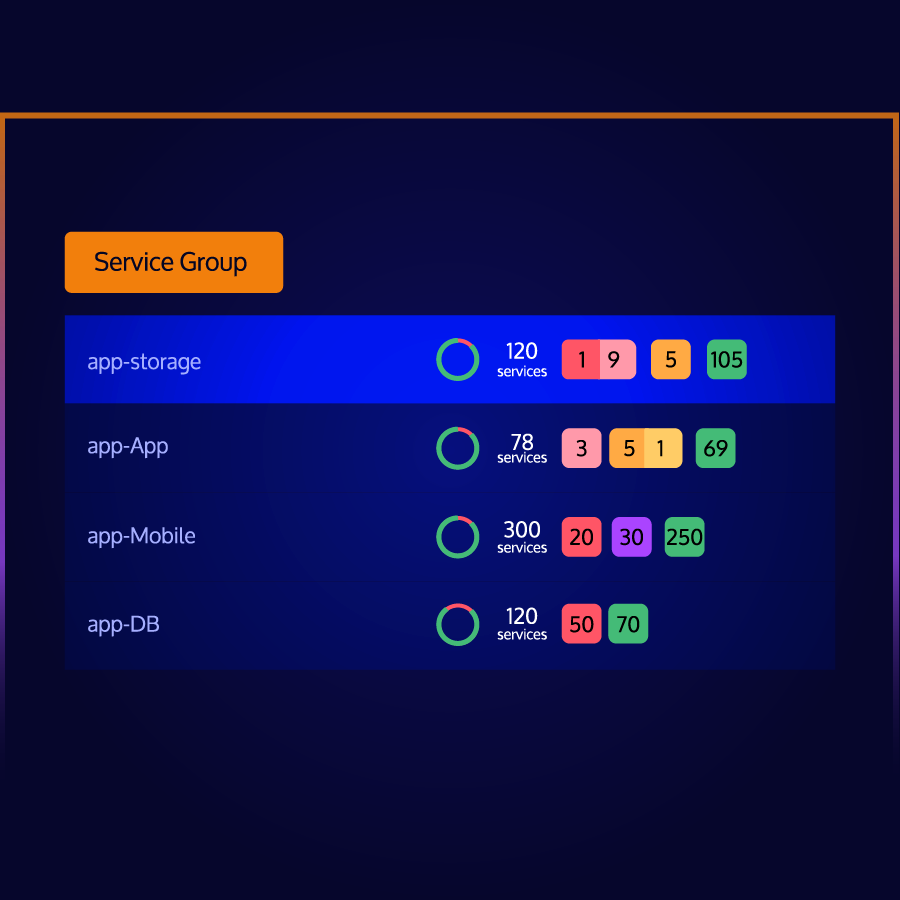
Custom Alerts
Receive instant notifications for critical issues before they impact users. Reduce noise with advanced filtering.
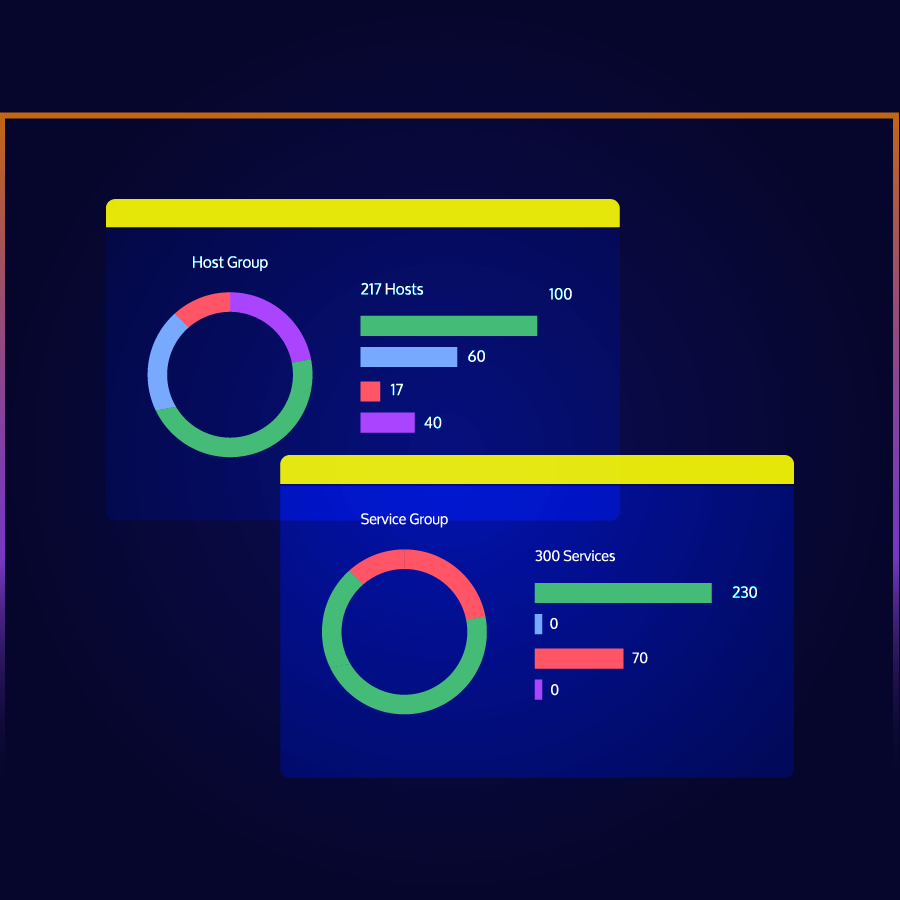
Integration Capabilities
Easily connect with cloud services, DevOps tools, and ITSM solutions to streamline your workflows.
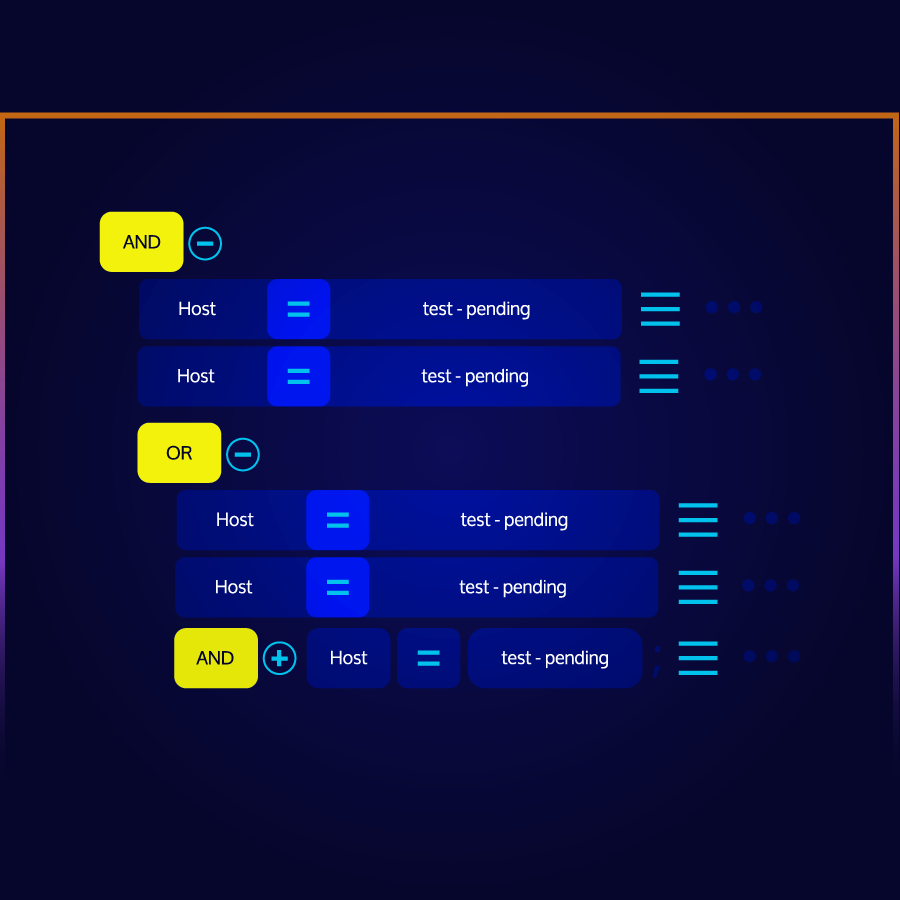
Trusted by Enterprises Worldwide
Core Features of Icinga for Enterprises
- Modular and Customizable
Adapt Icinga to your specific monitoring requirements. - Cloud & On-Prem Support
Monitor hybrid infrastructures smoothly. - Advanced APIs & Automation
Integrate effortlessly with existing workflows.
- Security and Compliance
Ensure IT governance and regulatory adherence. - High Availability & Performance
Scale to thousands of hosts without performance drops, with clustering capabilities ensuring no single point of failure.
Explore Icinga’s Capabilities

Infrastructure Monitoring
Learn more

Monitoring Automation
Monitor massive amounts of data.
Learn more

Cloud Monitoring
Learn more

Metrics & Logs
Get the context and recognize trends.
Learn more

Analytics
Learn more

Notifications
Learn more
Discover Our Detailed Monitoring Solutions
Icinga offers tailored monitoring solutions for different IT environments. Click on each category to learn more:
Seamless Integrations for Maximum Flexibility
Cloud & Infrastructure
Azure
AWS
NetBox
Incident Response
PagerDuty
VictorOps
SIGNL4
Jira
Frequently Asked Questions
What is Icinga and how does it work?
Icinga is an open-source monitoring solution that provides real-time visibility into IT infrastructures. It continuously checks the health and performance of networks, servers, applications, and services. When an issue arises, Icinga alerts IT teams so they can proactively resolve problems before they impact business operations.
Is Icinga truly open-source?
Yes, Icinga is open-source and can be freely used, modified, and extended. The strong community-driven development ensures continuous improvements, while optional enterprise support is available for those who need additional assistance.
What makes Icinga different from other monitoring tools?
Icinga is highly customizable, open-source, and scalable for enterprises with complex infrastructure. It provides high availability with distributed monitoring capabilities, making it a reliable and long term choice for demanding environments.
Who is Icinga best suited for?
Icinga is ideal for IT teams that require flexibility, granular control, and deep observability into their infrastructure. Powerful integrations and customization options make it perfect for enterprise environments.
Is Icinga completely free?
Yes, Icinga is an open-source monitoring software that is free to use. However, for enterprise Linux distributions like RHEL, Amazon Linux 2, and SLES, access to official Icinga packages requires a Repository Subscription. This subscription provides access to these packages and additional software extensions. For development and small-scale environments, a separate Developer Subscription is available.
Can Icinga monitor cloud environments like AWS, Azure, and Kubernetes?
Yes, Icinga supports monitoring for cloud-based environments, including AWS, Azure, and Kubernetes. It provides detailed insights into cloud resources, containerized applications, and hybrid infrastructures. With Icinga, IT teams can maintain visibility and control across both on-premises and cloud-based systems.
How easy is it to install and configure Icinga?
Icinga offers straightforward installation packages for all major Linux distributions, including Debian, Ubuntu, RHEL, and SLES. The installation process is well-documented with step-by-step guides, making it accessible even for those without extensive Linux experience. For basic setups, installation and configuration can be completed very quickly. However, larger and more complex environments benefit from Icinga’s flexible architecture, which allows for extensive customization, fine-tuned monitoring, and scalable deployments.
What are the system requirements for Icinga?
Icinga primarily runs on Linux-based systems, with official support for distributions like Debian, Ubuntu, RHEL, SLES and Amazon Linux. The resource requirements depend on the size of your monitoring environment. For smaller setups, minimal resources are sufficient, while larger enterprise environments may require additional CPU, memory, and storage capacity. Icinga’s modular architecture allows you to scale your monitoring infrastructure as needed by adding more nodes to the setup.
Does Icinga provide pre-configured templates for common use cases?
Icinga does not provide pre-configured templates by default. Instead, it offers extensive flexibility through modules and plugins that can be tailored to fit your specific monitoring needs. While there are best-practice guidelines available from the community and official documentation, most configurations are built manually to suit individual environments. This approach ensures maximum customization and adaptability.
How can I migrate from another monitoring tool to Icinga?
Icinga provides flexible migration options that make it easier to transition from other monitoring tools, especially those based on Nagios. Existing configurations can often be reused or adapted, thanks to Icinga’s compatible architecture. For other monitoring tools, migration requires manual configuration, but Icinga’s modular design and detailed documentation help simplify the process. Additionally, Icinga’s powerful APIs and integration capabilities ensure that it can be smoothly integrated into your existing monitoring environment, minimizing downtime and disruption.
Is Icinga completely free to use?
Yes, Icinga is open-source and free to use. However, for enterprise Linux distributions like RHEL, Amazon Linux 2, and SLES, access to official Icinga packages requires a Repository Subscription. For development and small-scale environments, a separate Developer Subscription is available.
Does Icinga offer enterprise support?
Yes, Icinga offers enterprise support for organizations that require professional assistance beyond the open-source community. This includes access to service-level agreements (SLAs) and assistance with complex deployments or custom integrations. Enterprise support is particularly valuable for large-scale environments where downtime is critical and advanced monitoring setups are required.
What kind of community and documentation support is available?
Icinga provides extensive documentation, an active community forum, GitHub discussions, and training to help users get the most out of the software.
How does Icinga integrate with existing IT infrastructure and tools?
Icinga supports numerous APIs, automation frameworks, and tools like Grafana, Prometheus, and Ansible. Whether on-premises or in the cloud, Icinga integrates smoothly into various architectures and workflows.


