Designing user interfaces for Icinga Web is always a bit of a balancing act. Once we’ve worked through all the technical and conceptual details of a new feature, it can be tough to step back and see...
How Quick User Tests Help Us Make Better UI Decisions in Icinga Web
Designing user interfaces for Icinga Web is always a bit of a balancing act. Once we’ve worked through all the technical and conceptual details of a new feature, it can be tough to step back and see...

How To Pick The Correct Metrics For Your Monitoring
This is a guest blogpost by Adam Sweet from the Icinga Partner Transitiv Technologies. Since this is a longer post, we added a tl;dr at the end. For many, host and application monitoring is an afterthought at the end of a project. Some people don’t think about...

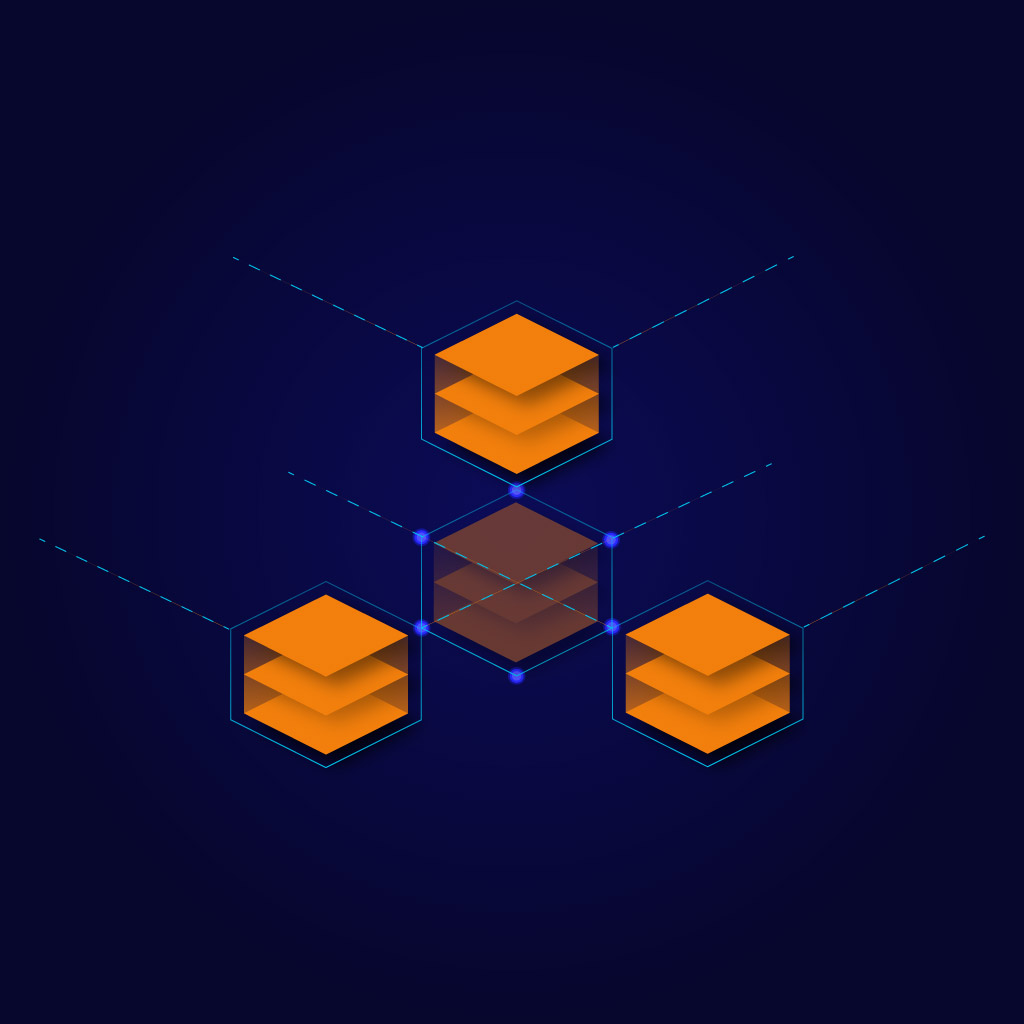
Monitor Microservices Effectively: A Practical Guide
Contents What Is Microservice Monitoring? Why Monitoring Microservices Is Different – and What It Means for You Key Metrics and Signals You Should Track Best Practices for Monitoring Microservices Monitoring Tools for Microservices: What to Look For Microservice...

Automatically Testing Icinga DB
In today's blog post, I want to present something related to Icinga DB that you most likely will not come in touch with as a regular user: some of the test cases we built for Icinga DB and the tooling created to support them. The Challenge Even though Icinga DB is a...

Announcing official Icinga packages for RHEL, Amazon Linux 2 and SLES
We are pleased to announce the general availability of Icinga installation packages for Red Hat Enterprise Linux, Amazon Linux 2 and SUSE Linux Enterprise Server. We extend the list of supported operating systems to give you even more options where you can run Icinga....
Icinga Web – Not just Black and White
Most of you know that Icinga Web can be adjusted by themes. Some of you also have made some! Icinga Web itself comes with several themes since the early days. Now with the next upcoming major update v2.10 we'll take themes to their next evolution. But since we've...
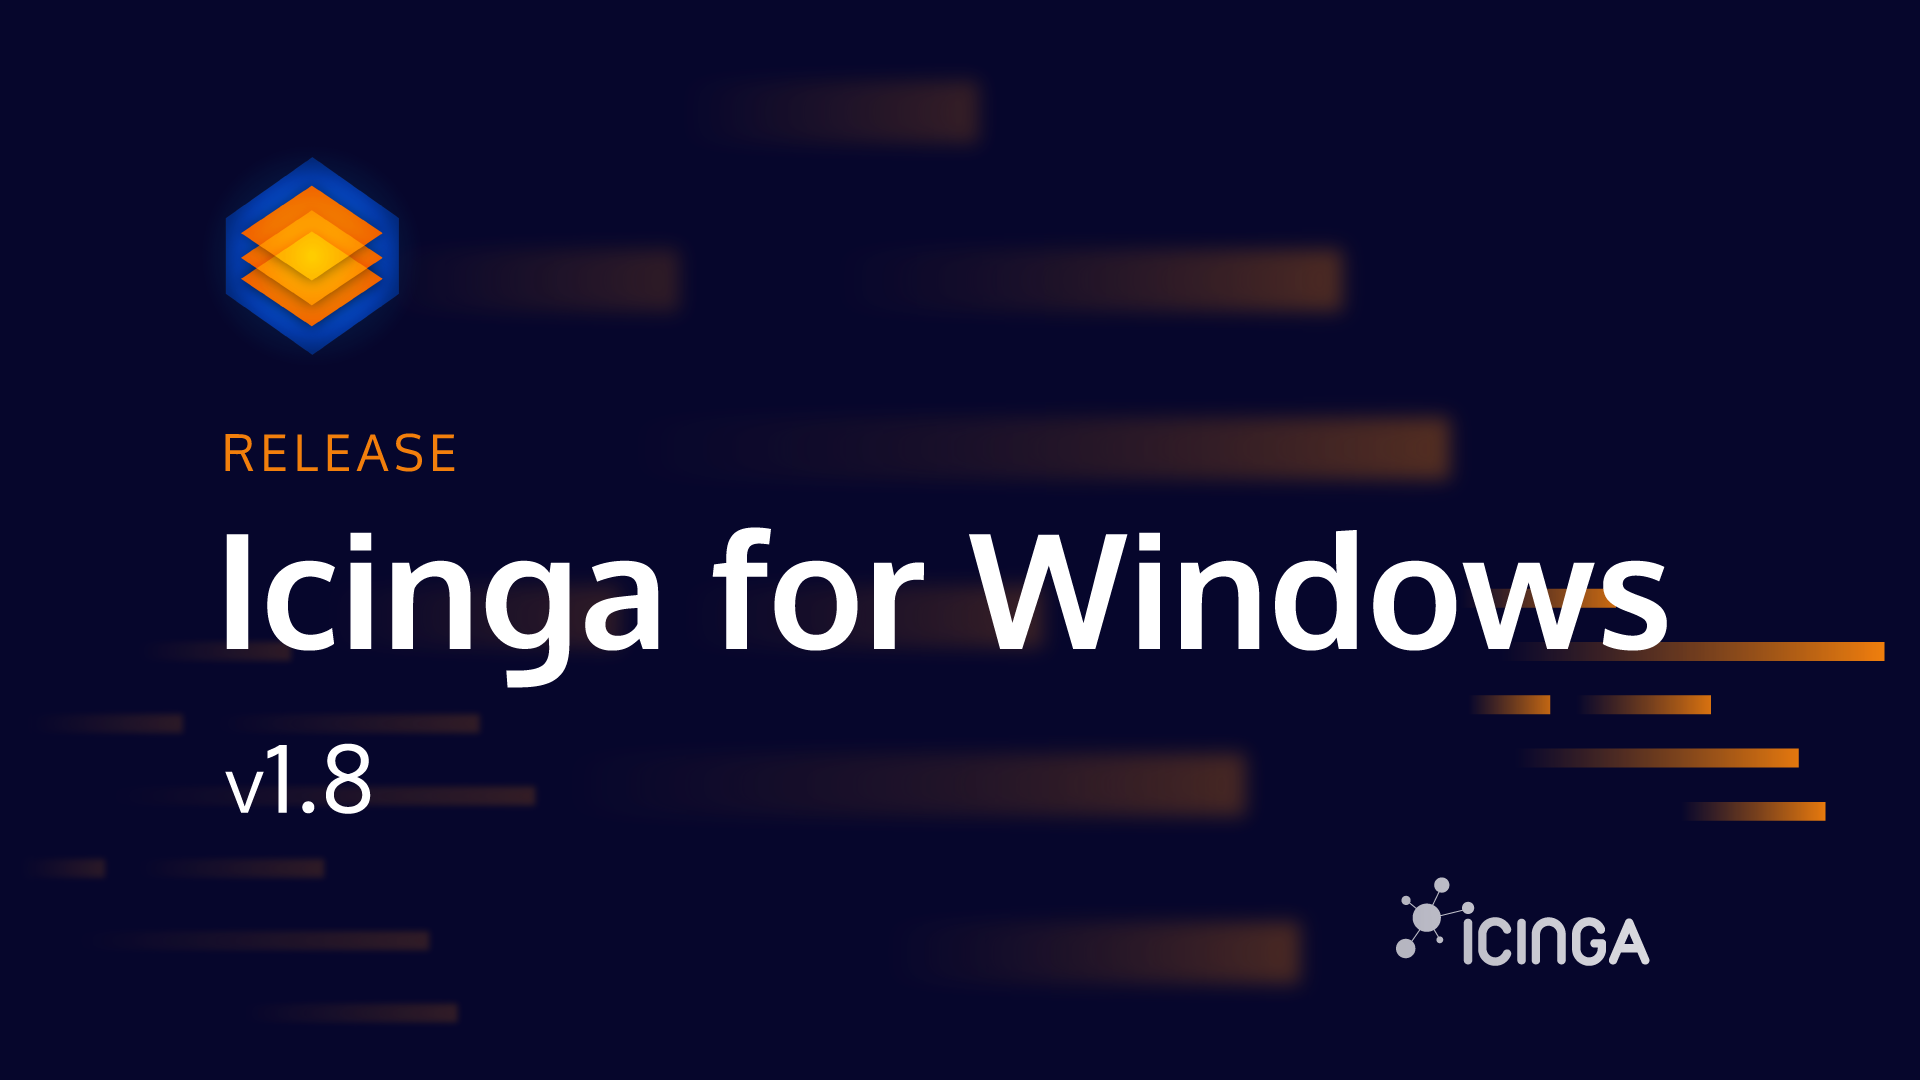
Releasing Icinga for Windows v1.8.0 – The Power of Rework
Today we are happy to announce that after month of work we finally can release Icinga for Windows v1.8.0. As discussed in our live Icinga for Windows Q&A on our YouTube-Channel, we spent lots of time resolving issues reported by our community and customers and in...
Introduction to (Performance) Monitoring Metrics
To ensure the reliability and stability of your services, it's essential to understand the overall health of your infrastructure and systems. That variety of information from your systems helps you to get a proper context during your root cause investigation and react...
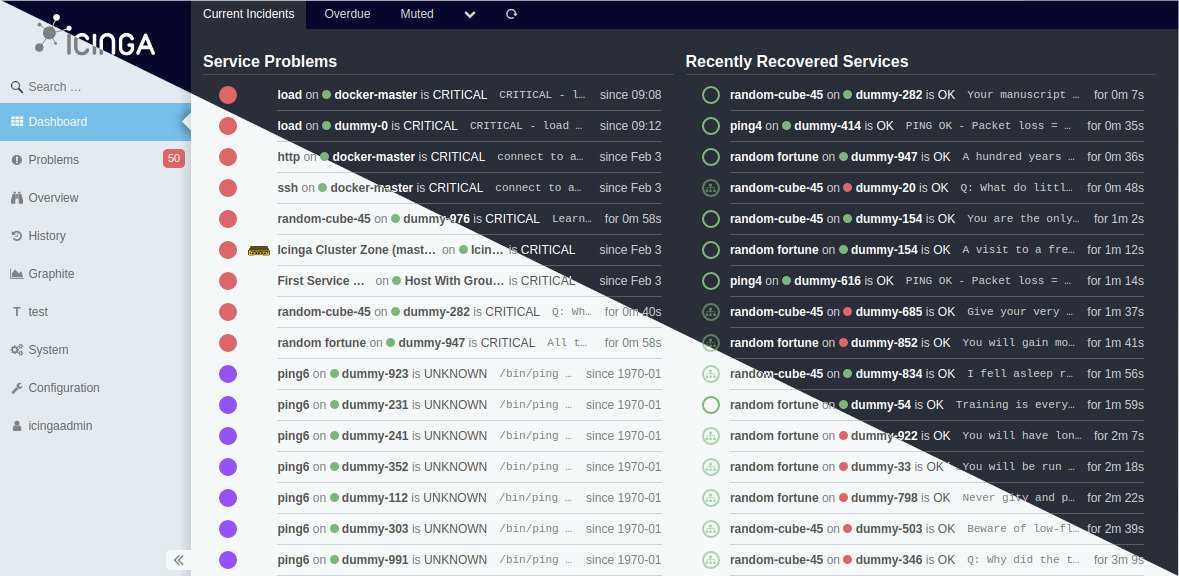
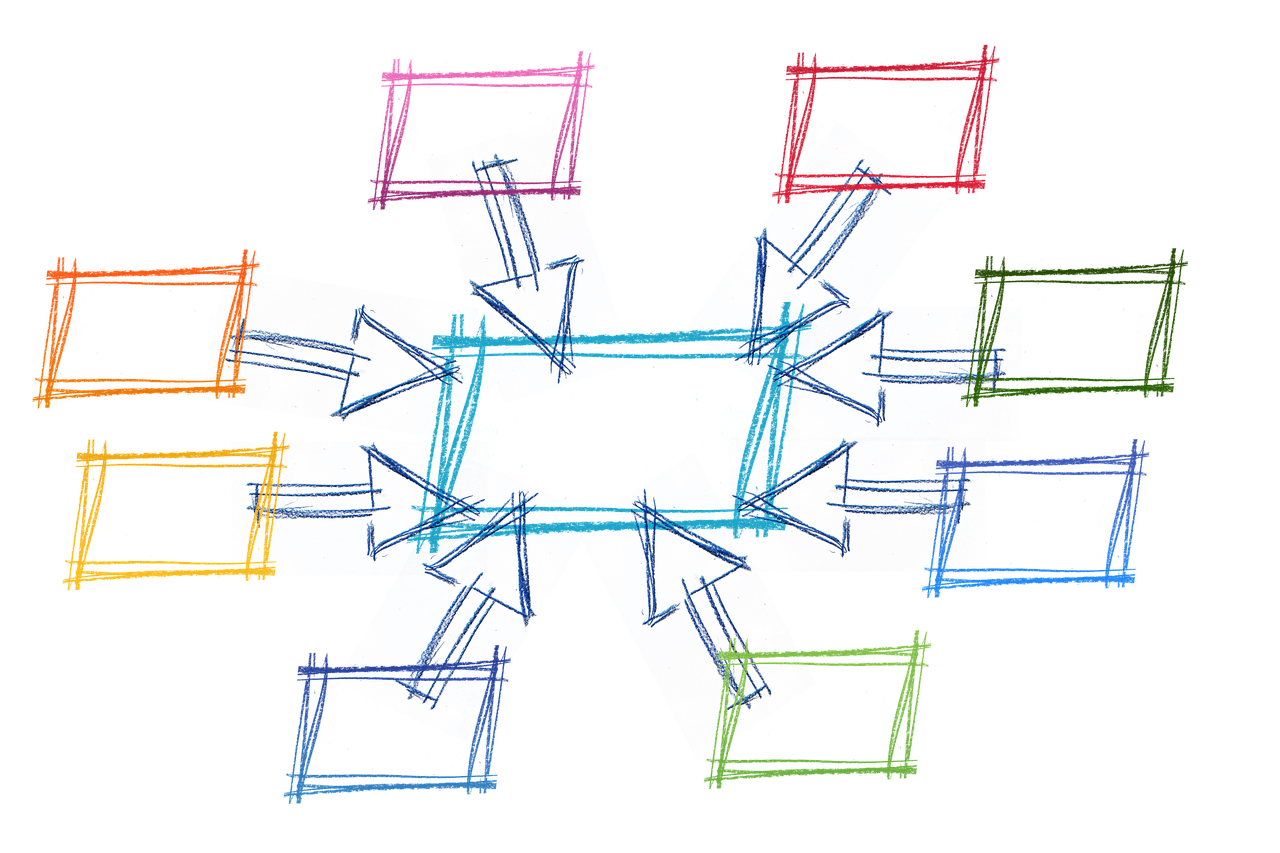
Why you need network monitoring?
Network monitoring is a continuous analysis of a network to detect and correct any performance issues. Network monitoring involves collecting network statistics to determine the quality of services offered by the network. With tools like Icinga, it's possible to...
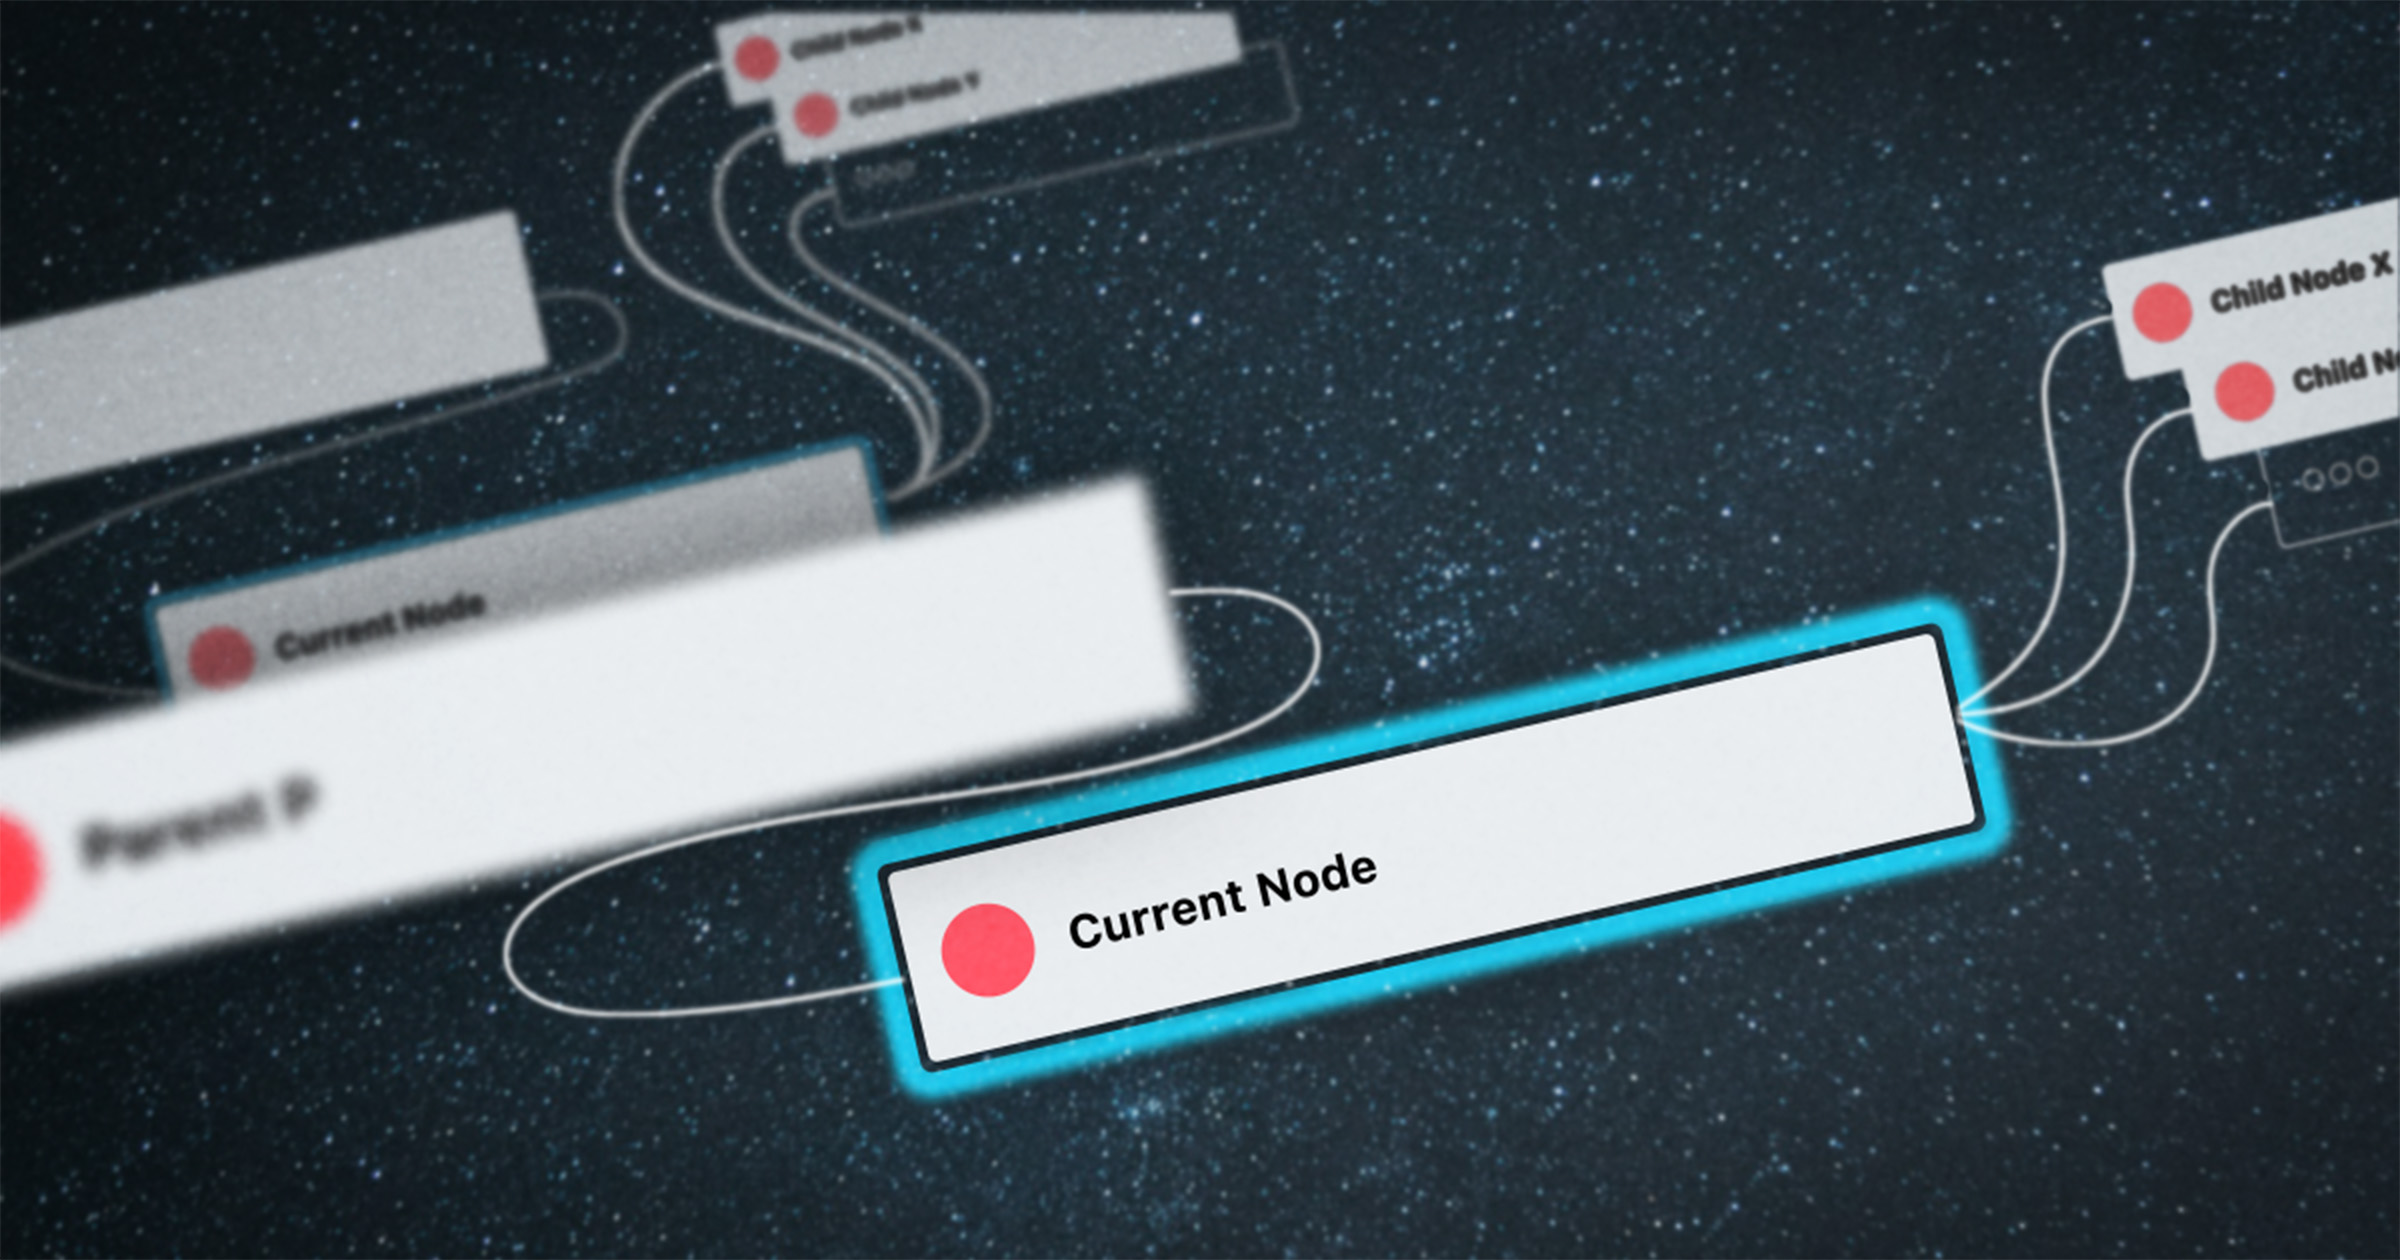
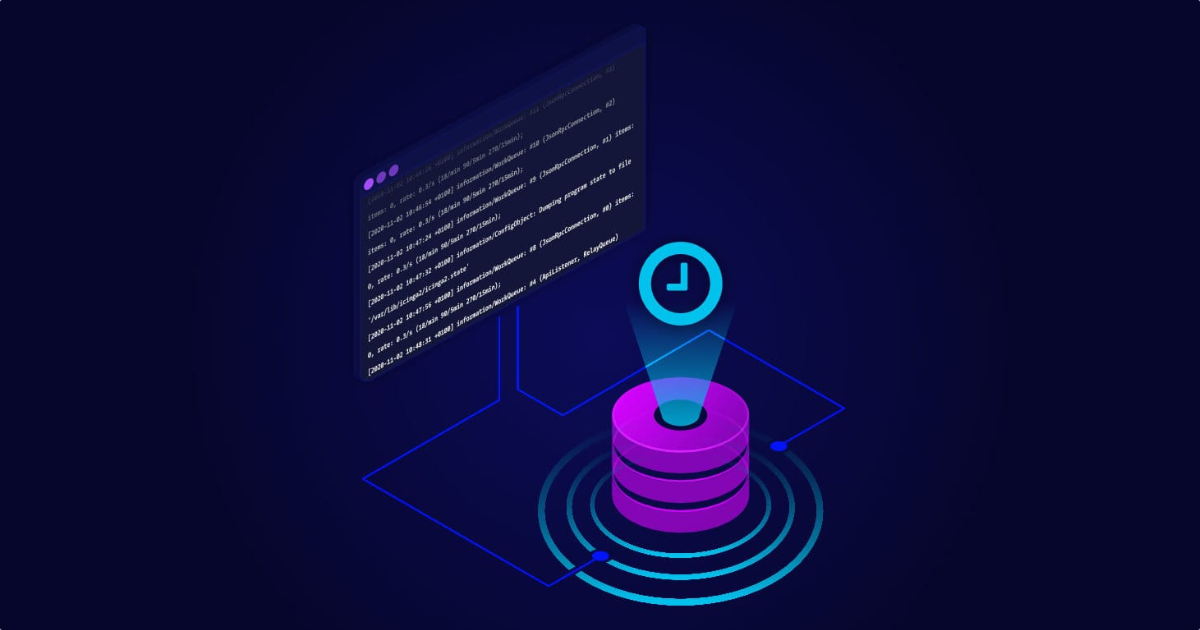
Replay Log in Distributed Icinga Environments
An essential part of a distributed monitoring environment with Icinga that includes master, satellite and agent nodes is the replay log functionality. The replay log is a built-in mechanism to ensure nodes in a distributed setup keep the same history e.g. check...
Introducing Icinga Module for vSphere – Releasing version 1.2
One of the pillars of Icinga is integrations. With it's open APIs and various extensions, Icinga is capable of integrating seamlessly into your existing infrastructure. Today I want to give you an introduction to our VMware integration and share some details about the...
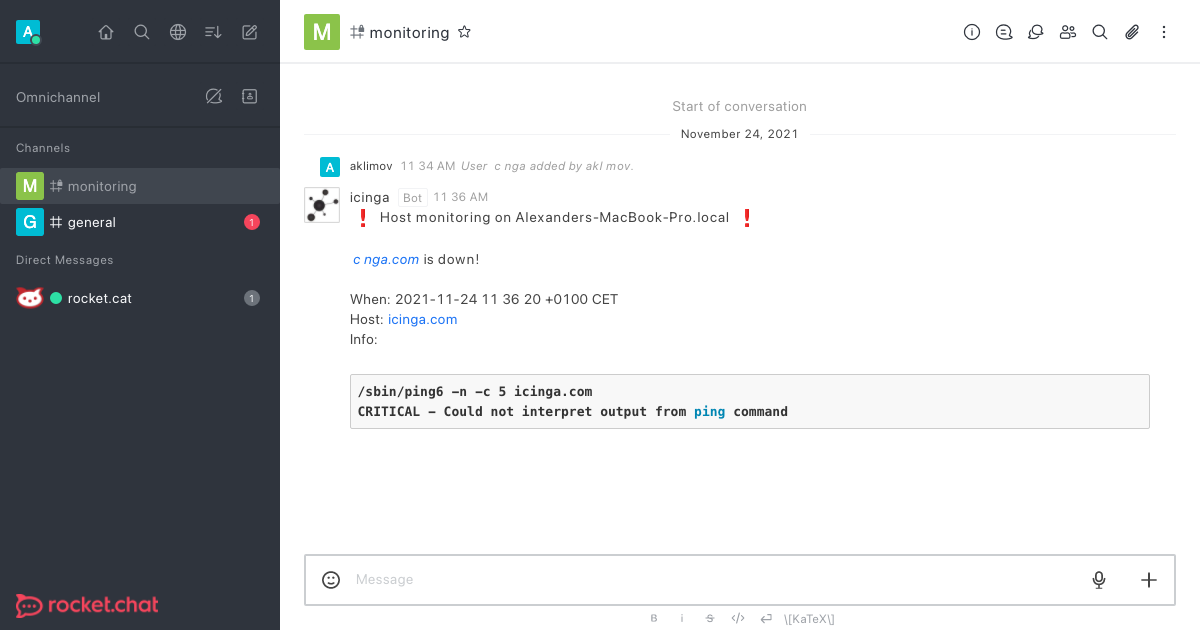
Icinga 2 Rocket.Chat notifications. The complete guide
About one year ago the NETWAYS colleagues showed you how to let Icinga 2 notify users through XMPP/Jabber. Now it's time to also cover the somewhat more fancy Rocket.Chat. No Rocket.Chat? No problem! Setting up a test system is pretty easy: Clone this Git repository...

Subscribe to our Newsletter
A monthly digest of the latest Icinga news, releases, articles and community topics.
