The Icinga Director configuration tool makes it easy to define monitoring objects through the web UI and deploy them to the Icinga 2 API. In this blog post, I’ll walk you through how to configure...
Mastering Service Configuration in Icinga Director
The Icinga Director configuration tool makes it easy to define monitoring objects through the web UI and deploy them to the Icinga 2 API. In this blog post, I’ll walk you through how to configure...
Icinga DB Web Automation
Icinga DB Web Automation allows you to automate monitoring tasks and integrate them directly into your systems and workflows. It is possible to issue command actions without a browser. To do so, a form needs to be submitted by a tool such as cUrl. Every request you...
Endpoint Monitoring with Icinga
Monitoring with Icinga primarily focuses on servers and infrastructure. But there are also the people operating these systems from their workstations and laptops. If a server can be accessed from a machine with an outdated operating system, the patch level of the...
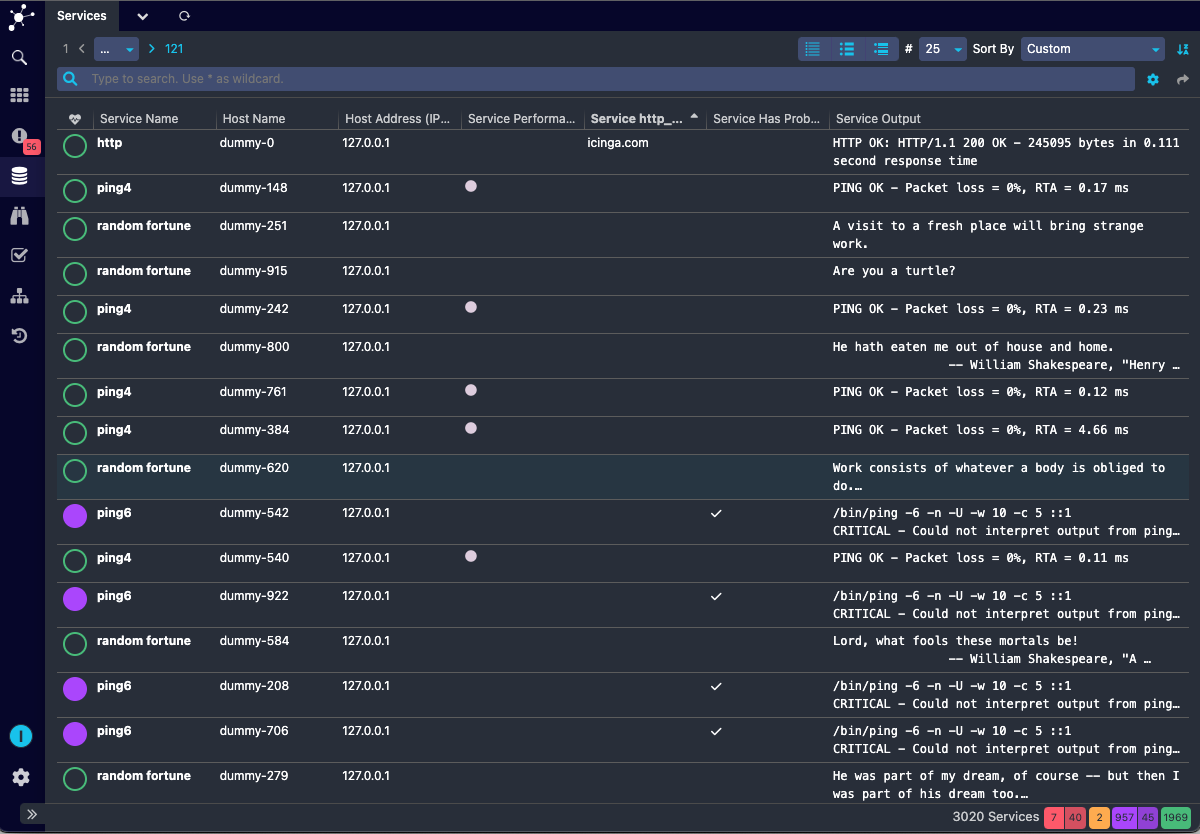
List View in Icinga DB Web
Similar, to the monitoring module in Icinga Web, Icinga DB Web also provides list views for hosts and services to provide the most common columns to reduce the backend query load. The columns URL parameter is used to provide the columns that are needed for the list...
Icinga for Windows v1.10.0 – The Next Level
After some drawbacks we are very happy today to finally release Icinga for Windows v1.10.0! The past weeks we have spent a lot of time to polish this release, test many different aspects and optimize the user experience in general. Please make sure to read the...

Use actual data in Sketch for more realistic mockups
This time I want to show a feature that's not obvious at first sight, but can save a lot of time, when you're intending to create UI mockups with realistic data. Why it is important to test UI concepts with realistic data at a certain point In my opinion it's totally...
Releasing Icinga 2.13.5
Today we are releasing Icinga 2.13.5. It addresses issues with 2.13.x-only changes such as logging startup messages to Windows event log or Icinga DB. In addition, the bundled dependencies on Windows are updated to the latest available versions. Changes Ensure...

More reliable host and service history with Icinga DB
Today's blog post will give an insight into one of the many things that improved with Icinga DB: how host and service history is written to the database, both by the old IDO feature, as well as what has changed with Icinga DB and how this leads to more reliable...

Icinga Camp Berlin 2022
Our first Icinga Camp after 2019 now took place almost 3 years later and was an amazing event that took us right back in time. We tried to create an atmosphere where we could share our current state of things, introduce new features and have people who work with...

Why is infrastructure monitoring important?
Infrastructure monitoring is used to collect health and performance data from servers, virtual machines, containers, databases, and other backend components in a tech stack. How infrastructure Monitoring works Infrastructure monitoring tracks the availability,...
Releasing Icinga Director Branches
Many Icinga users favour the Icinga Director to manage their Icinga configuration. Icinga Director comes with many features to enable you to create and modify Icinga configuration through the web interface. One outstanding feature of Icinga Director is the Activity...

Icinga for Windows Preview: Visualize your Metrics!
It has been a while since we published some news regarding Icinga for Windows - that's why we would like to tell you one month ahead about a big change which follows with version 1.10 in August. The Long Journey Since the first release of Icinga for Windows including...

Subscribe to our Newsletter
A monthly digest of the latest Icinga news, releases, articles and community topics.
