Today we announce a security update for Icinga PHP Library. It solves a severe cross-site scripting attack vulnerability and affects multiple Icinga products at once. It has been published as...
XSS Vulnerability in Icinga PHP Library
Today we announce a security update for Icinga PHP Library. It solves a severe cross-site scripting attack vulnerability and affects multiple Icinga products at once. It has been published as...

Icinga as Open-Source MSP Monitoring Software: Multi-Tenant Monitoring for IT Service Providers
Icinga is an open-source MSP monitoring software used by managed service providers to monitor multi-tenant client environments at scale. It covers the infrastructure layer that RMM tools don't reach: network devices, custom service checks, SLA reporting, and deep...
Four Modern PHP Features That Show How Far the Language Has Come
PHP has evolved over the years and has become a lot reliable, faster and refined. And with the release of PHP 8, which contained many features (named arguments, union types, attributes, constructor property promotion, match expressions, the null safe operator (?->)...
How We Schedule Tasks in PHP at Icinga – A Look Behind the Scenes
When building software like Icinga, some of the most critical operations happen silently in the background. Recurring tasks whether for collecting data, renewing certificates, or generating reports are essential to delivering the functionality our users rely on every...
Releasing Icinga vSphere® Integration v1.5.0
Our Icinga vSphere® module has reached a new milestone, v1.5.0. It contains some buxfixes and a lot of new features and improvements. For all details, check the full changelog. UI In the v1.5 you might notice a few updates on the UI. A lot of the changes are smaller...

IPL – Icinga PHP Library
A few years ago, we introduced a new, completely independent library. The IPL - Icinga PHP Library, a bundle of Icinga PHP libraries. Since then we are actively working on further development and adding new features. Today I would like to highlight individual parts of...
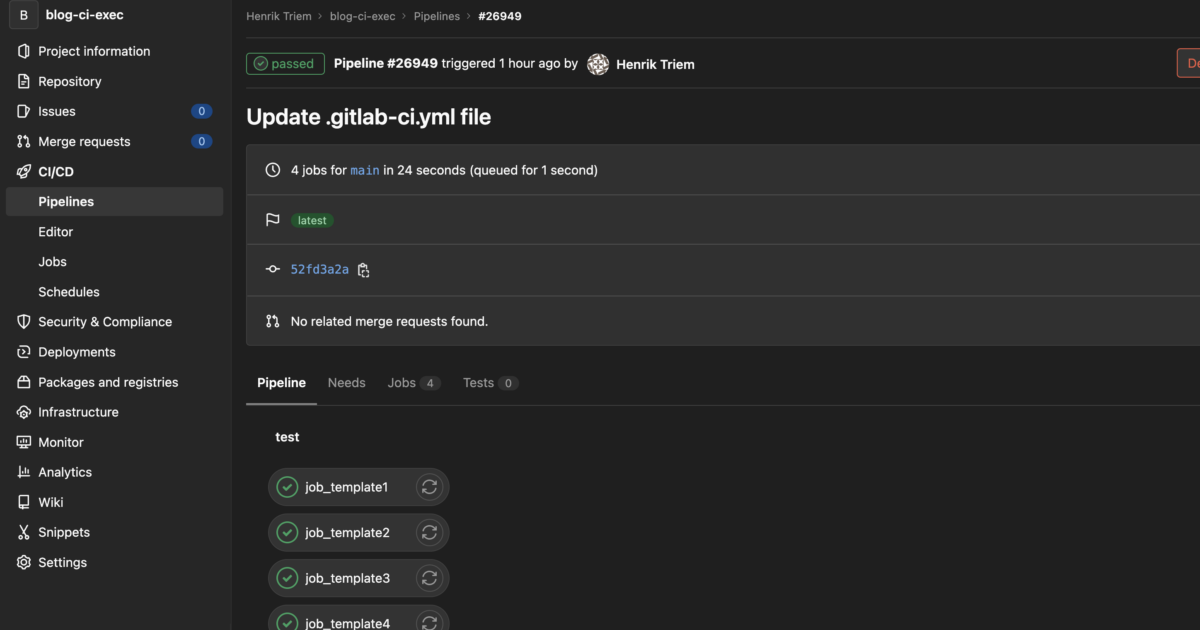
GitLab CI/CD Job Templates!
Like I’ve mentioned in my last blog post, we use GitLab pipelines for packaging. We have a lot of software, like Icinga, Icingaweb and its various modules, which we want to build across multiple different operating systems. This results in a huge number of jobs and...
Icinga & Apache Guacamole – A Powerful Combination for Remote Access
This is a guest blogpost from Cecilia Gripenberg from RedBridge Integration Magic One of Icinga’s greatest strengths is its ability to integrate with other systems and use those systems’ data to enrich monitoring. It can write time-series data to InfluxDB, Graphite or...
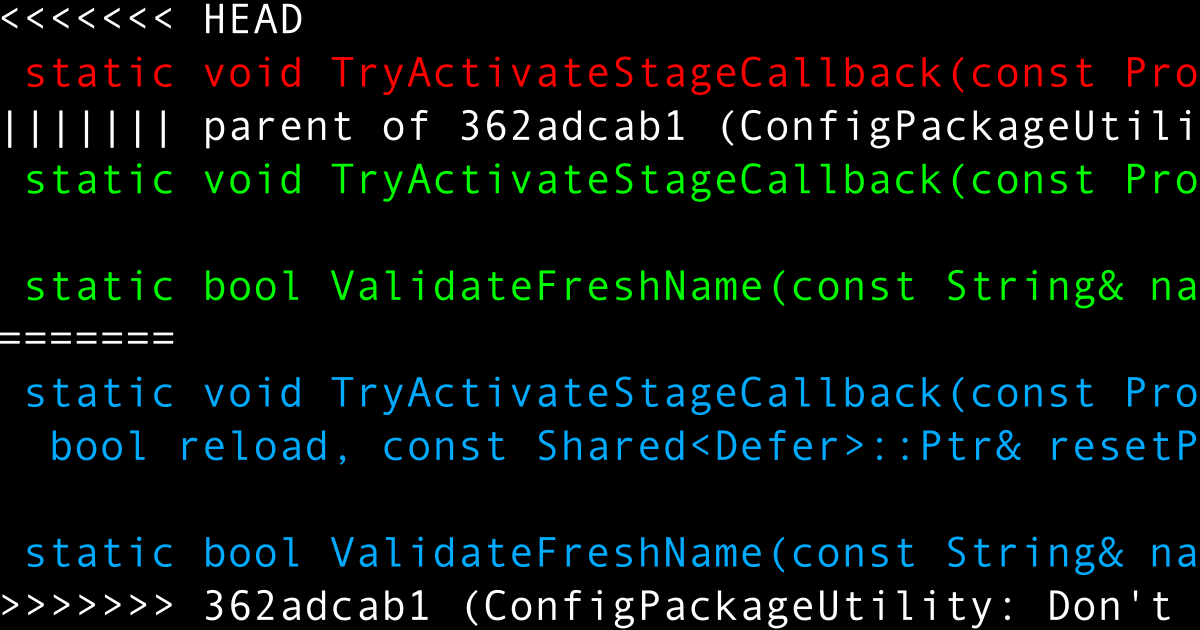
Resolving Git merge conflicts – easily and accurately
Nobody likes resolving merge/rebase/cherry-pick conflicts. I also don't, but I've found a scheme how to reduce the built-in headache. In this post I'm going to share my findings as well as practical examples. Warming up First let's brush up on merge conflicts with...

How to Create Custom-Branded Icinga Reports – Quick Tip
With Icinga Reporting you can create custom SLA reports for hosts and services that are monitored with Icinga. The module for Icinga Web fetches existing data and takes planned downtimes into account. You can filter for certain hosts and services as well as set custom...
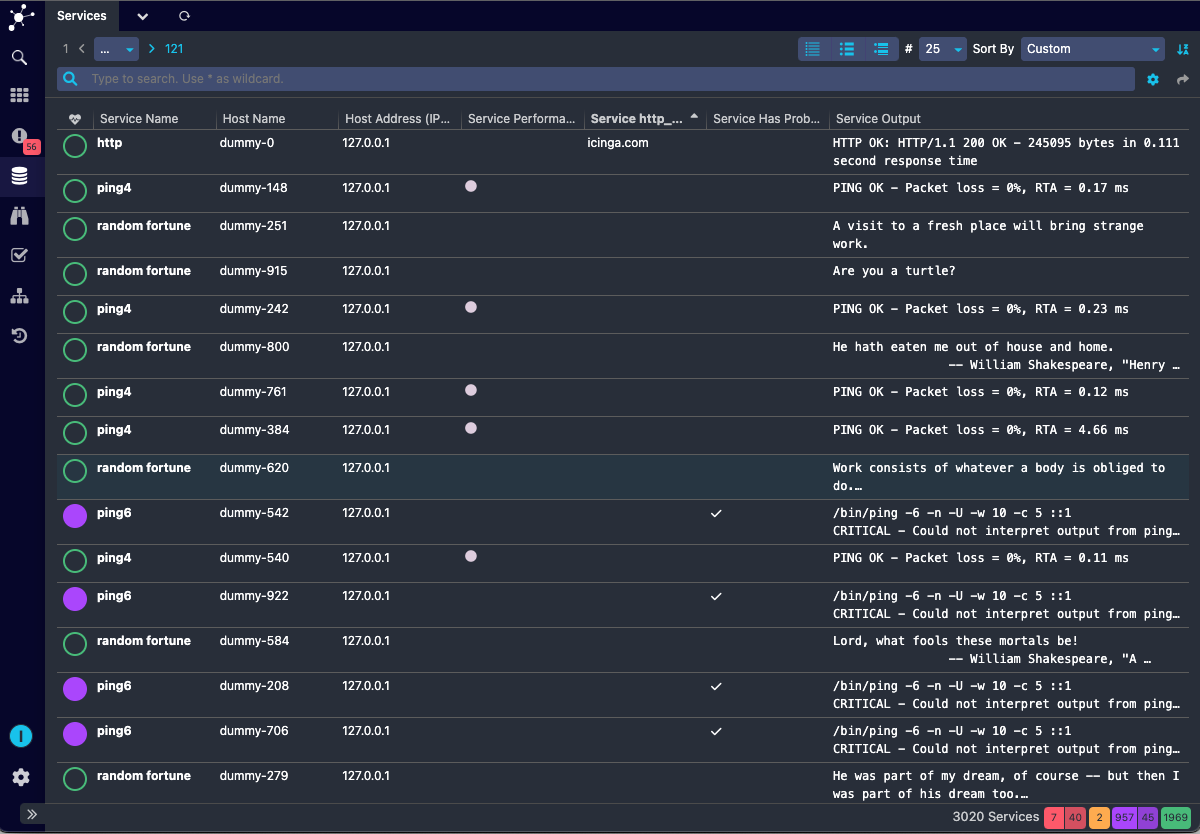
List View in Icinga DB Web
Similar, to the monitoring module in Icinga Web, Icinga DB Web also provides list views for hosts and services to provide the most common columns to reduce the backend query load. The columns URL parameter is used to provide the columns that are needed for the list...
Icinga for Windows v1.10.0 – The Next Level
After some drawbacks we are very happy today to finally release Icinga for Windows v1.10.0! The past weeks we have spent a lot of time to polish this release, test many different aspects and optimize the user experience in general. Please make sure to read the...

Subscribe to our Newsletter
A monthly digest of the latest Icinga news, releases, articles and community topics.
