The OTLPMetricsWriter is a new Icinga 2 feature available since v2.16 that exports check plugin performance data as OpenTelemetry-compliant metrics via the OTLP HTTP protocol. With a single...

Icinga 2 Meets OpenTelemetry: Native Metrics Export in v2.16
The OTLPMetricsWriter is a new Icinga 2 feature available since v2.16 that exports check plugin performance data as OpenTelemetry-compliant metrics via the OTLP HTTP protocol. With a single...

Mirroring Icinga Packages in Air-Gapped and Restricted Environments
When hosting in a secure or corporate environment, Internet access is often restricted or blocked completely. While this makes sense from a security point of view, this introduces some challenges. For one, getting software packages. There are usually two approaches to...
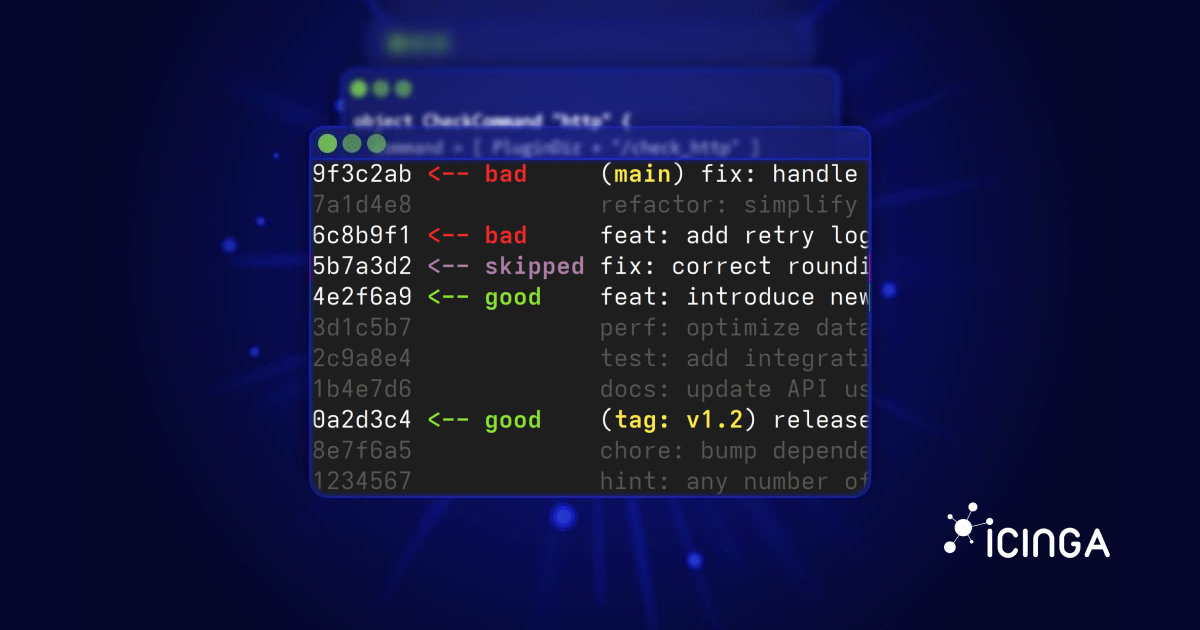
How to Use Git Bisect to Pinpoint Bugs Precisely
A feature that used to work suddenly broke. The problem? There were 300 commits since the last time I knew it worked. Checking each commit manually would take forever. Fortunately, Git has a tool designed exactly for this situation: git bisect. What is Git Bisect? The...

Mapping Hostnames to Locations with Icinga Director – A Step-by-Step Guide
Recently I came across the Maps module build and maintained by our community. The module displays host objects and annotations on openstreetmap using the JavaScript library leaflet.js. The module reads the coordinates for each host from custom variables and is able to...
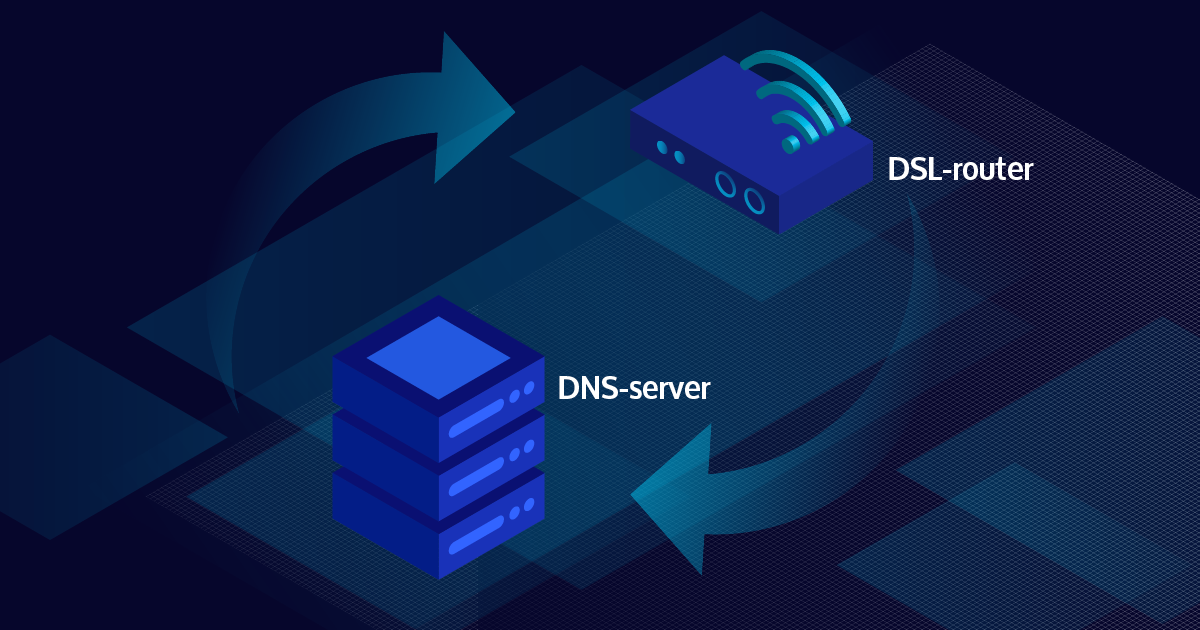
How to resolve circular dependency in Icinga2
We recently announced the general availability of Icinga 2.14, which most of you might have noticed, and with that in mind, I'd like to show you how you can easily troubleshoot and eliminate some of the dependencies headaches known as the dependency cycle. What does...
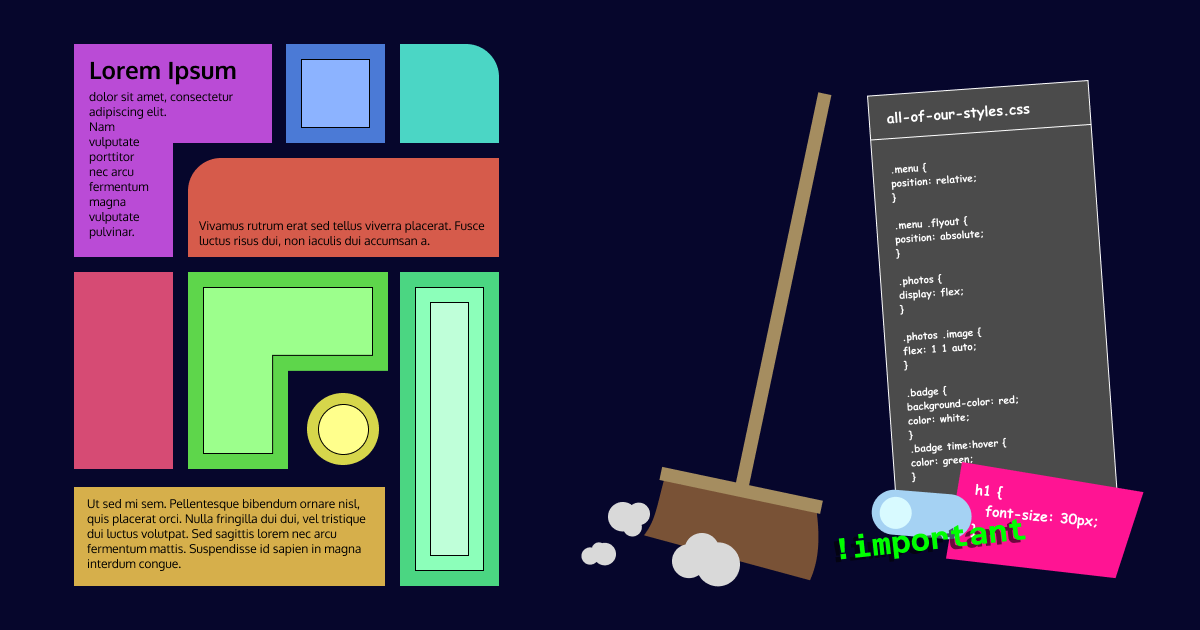
CSS doesn’t need to be ugly
Ever looked at some CSS and your first instinct was to close the editor and never look at it again? I did. Though, I don't have the luxury to close the editor in such a case, as is probably often the case for others as well. Code grows with time and so do bad...
Icinga Kubernetes Helm Charts
Daniel Bodky and Markus Opolka from our partner NETWAYS developed the very first Icinga Kubernetes Helm Charts and released it in an alpha version. If you have ever wanted to deploy an entire Icinga stack in your Kubernetes cluster, now is your chance. I also want to...

IPL: How to use ipl-validator
In my last blogpost I explained how our ipl-html lib works and how to use it. With the help of ipl-html it is possible to add forms. Usually we want to validate the data of the form before submitting it and display messages if the validation fails. For this purpose,...
Leveraging component variants in Figma for UI Design
Being a Sketch user since it's early days, I found Figma looked really promising, when it finally appeared. While Sketch caught up on most of Figma's features, like collaboration, developer handoff and AutoLayout (at least to some degree), the small feature set...
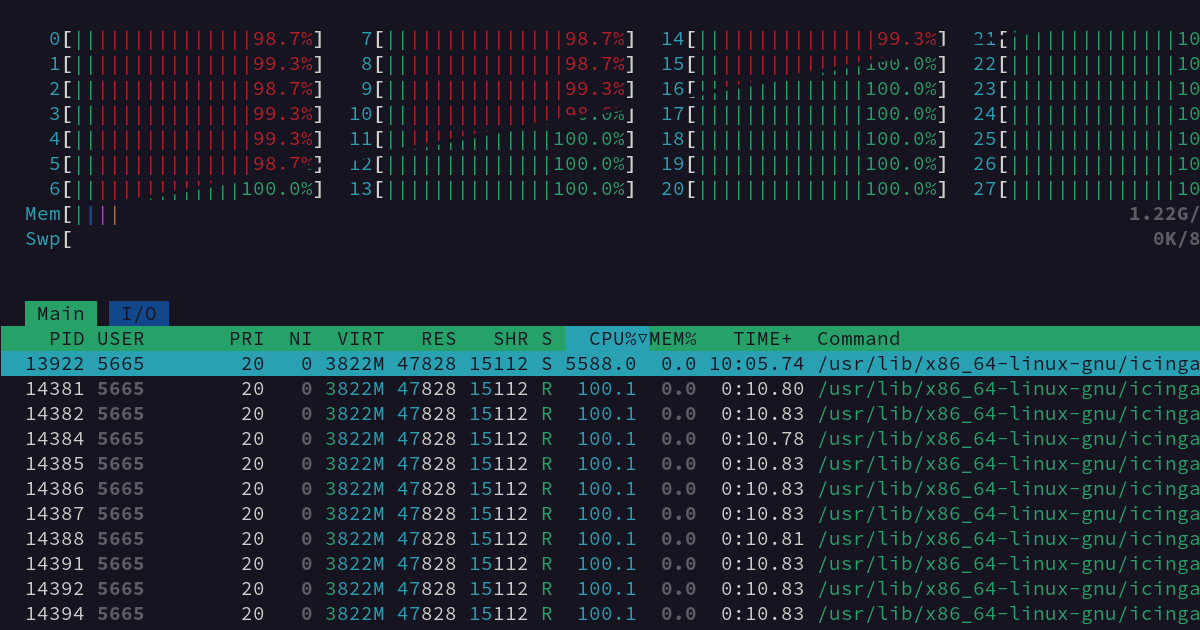
The Tale of a Single Lock in Icinga 2
To speed up startup and reload times of Icinga 2, we have already put a lot of effort into improving the configuration load performance and still continue to do so for the next major release. In this blog post, I will share the story of one particular issue we found,...

IPL: How to use ipl-html
In my previous blogpost I briefly explained the IPL and the tasks that these individual libs can perform. Today I want to explain how our ipl-html lib works and how to use it. This library helps you write HTML in a very simple and safe way. You don't need text...

Authenticating Icinga 2 API Users with TLS Client Certificates
When interacting with the Icinga 2 API, the client is commonly authenticated using a password provided via HTTP basic auth. Icinga 2 also supports a second authentication mechanism: TLS client certificates. This is a feature of TLS that also allows the client to send...

Subscribe to our Newsletter
A monthly digest of the latest Icinga news, releases, articles and community topics.
