Toady, we are releasing multiple new versions of Icinga 2 and Icinga for Windows, all of them fixing a file permission issue present in all installations on Windows. Impact The following paths were...
Releasing Icinga 2 v2.15.2, v2.14.8, v2.13.14 and Icinga for Windows v1.13.4, v1.12.4, v1.11.2
Toady, we are releasing multiple new versions of Icinga 2 and Icinga for Windows, all of them fixing a file permission issue present in all installations on Windows. Impact The following paths were...
SolarWinds Alternative: Why Icinga Is the Open Source Option for Scalable Infrastructure Monitoring
Searching for a SolarWinds alternative usually happens at a turning point. For some organizations, it starts with a renewal quote that exceeds expectations. For others, it follows a strategic review of vendor risk, subscription lock-in, or long-term monitoring costs....
How to Fix Cyclic Inheritance Errors in Icinga Director during Object Configuration
Icinga Director is a powerful tool that greatly simplifies the configuration, management, and deployment of monitoring objects in Icinga. It provides a user-friendly interface and automation features that make complex setups easier to maintain. Occasionally, though,...
The most important infrastructure monitoring requirements
When setting up new monitoring software or migrating, it's important to have a strong backbone in place for the systems, so you can cover as many services with as little manual burden as possible. Of course, defining the resources - like HTTP, SSH, etc. services or...
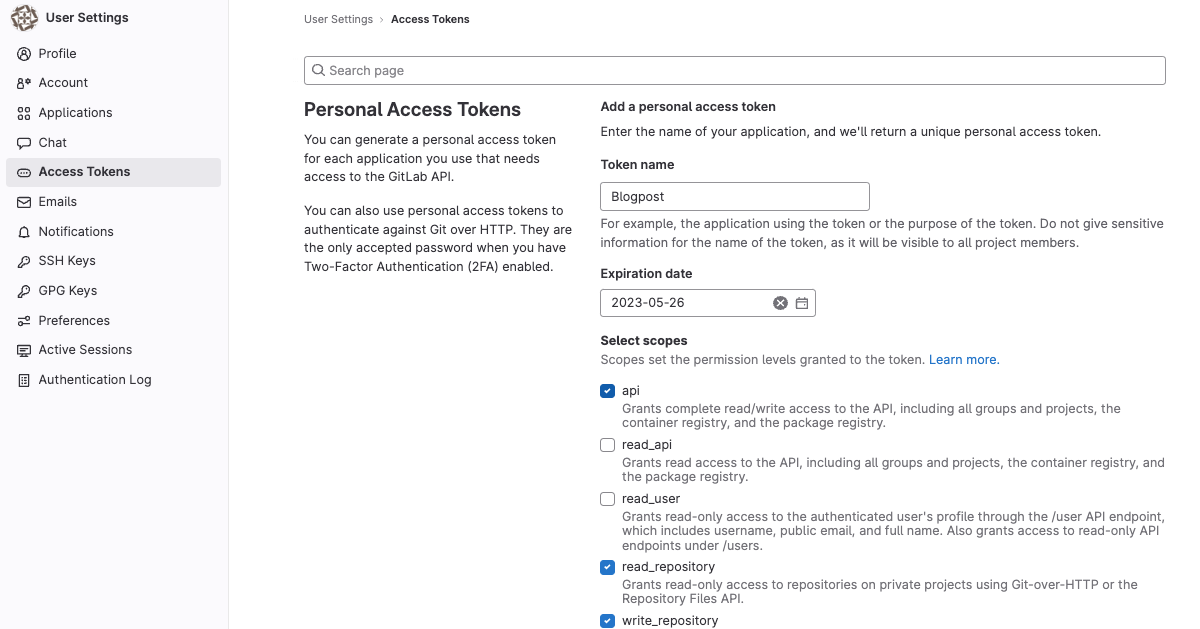
A Short Overview: GitLab Tokens
During my recent work on extending our GitLab packaging capabilities, I came across various types of tokens that can be used to authenticate users, services, and pipelines while using GitLab CI/CD. Each token has its unique features and use cases that can help ensure...
Feedback Week & Community Call
It's here! We're starting today! The Icinga Feedback Week: an entire week dedicated to you, as well as honoring those that are dedicated to the community. By asking you questions and getting your answers, we’re gathering your thoughts and feedback, which are very...

Why is Icinga called Icinga?
It's the year 2009, a nice weekend in late spring and a small group of monitoring enthusiasts comes together to discuss how to move forward with the idea of forking Nagios. Plans were made to make it faster, easier, more scalable, and simply better. Of course, such a...
Why Open Source Cloud Monitoring?
When operating a larger business or project, one problem comes quickly apparent: How can I know that my servers and their applications are up and the performance is good across the board? The answer is, of course, monitoring software. But why someone should consider...

Icinga DB Web deep custom variable filter
In this blog post I will introduce you to filtering, based on deep custom variables in Icinga DB Web. In Icinga Web 2 monitoring module, it is not possible to filter deep custom variables. Example of deep custom variables involving dictionaries and arrays: vars.dummy...
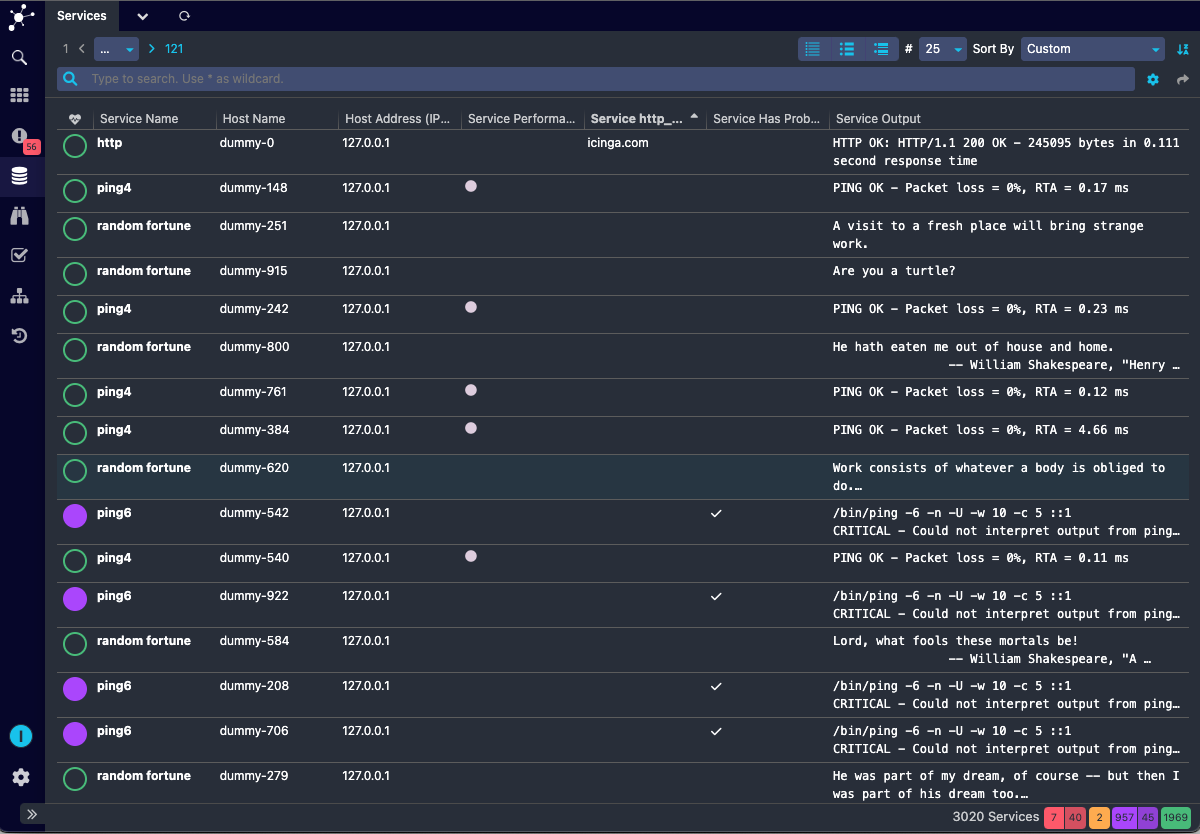
List View in Icinga DB Web
Similar, to the monitoring module in Icinga Web, Icinga DB Web also provides list views for hosts and services to provide the most common columns to reduce the backend query load. The columns URL parameter is used to provide the columns that are needed for the list...

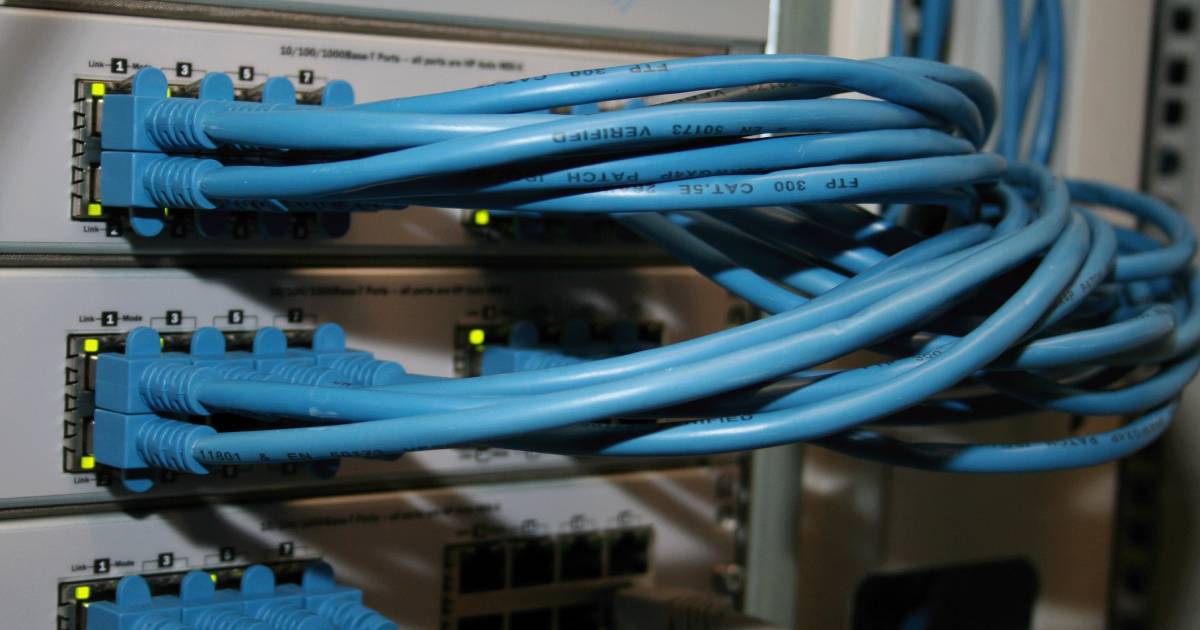
Why is infrastructure monitoring important?
Infrastructure monitoring is used to collect health and performance data from servers, virtual machines, containers, databases, and other backend components in a tech stack. How infrastructure Monitoring works Infrastructure monitoring tracks the availability,...

Using Sketch Symbols to boost the UI mock up workflow 🚀
As you may have noticed in one of my last posts, I’m not super averse to using Sketch in my daily workflow. Still, for creating UI mock ups, both high low quality, Sketch is the graphics tool, that I feel most comfortable in, because it enables me to work and ideate...

Subscribe to our Newsletter
A monthly digest of the latest Icinga news, releases, articles and community topics.
