Current Limitation: Dashboard Sharing Not Yet Supported Unlike menu items, dashboards in Icinga Web 2 currently can't be shared across users. This is something we will implement in future versions,...
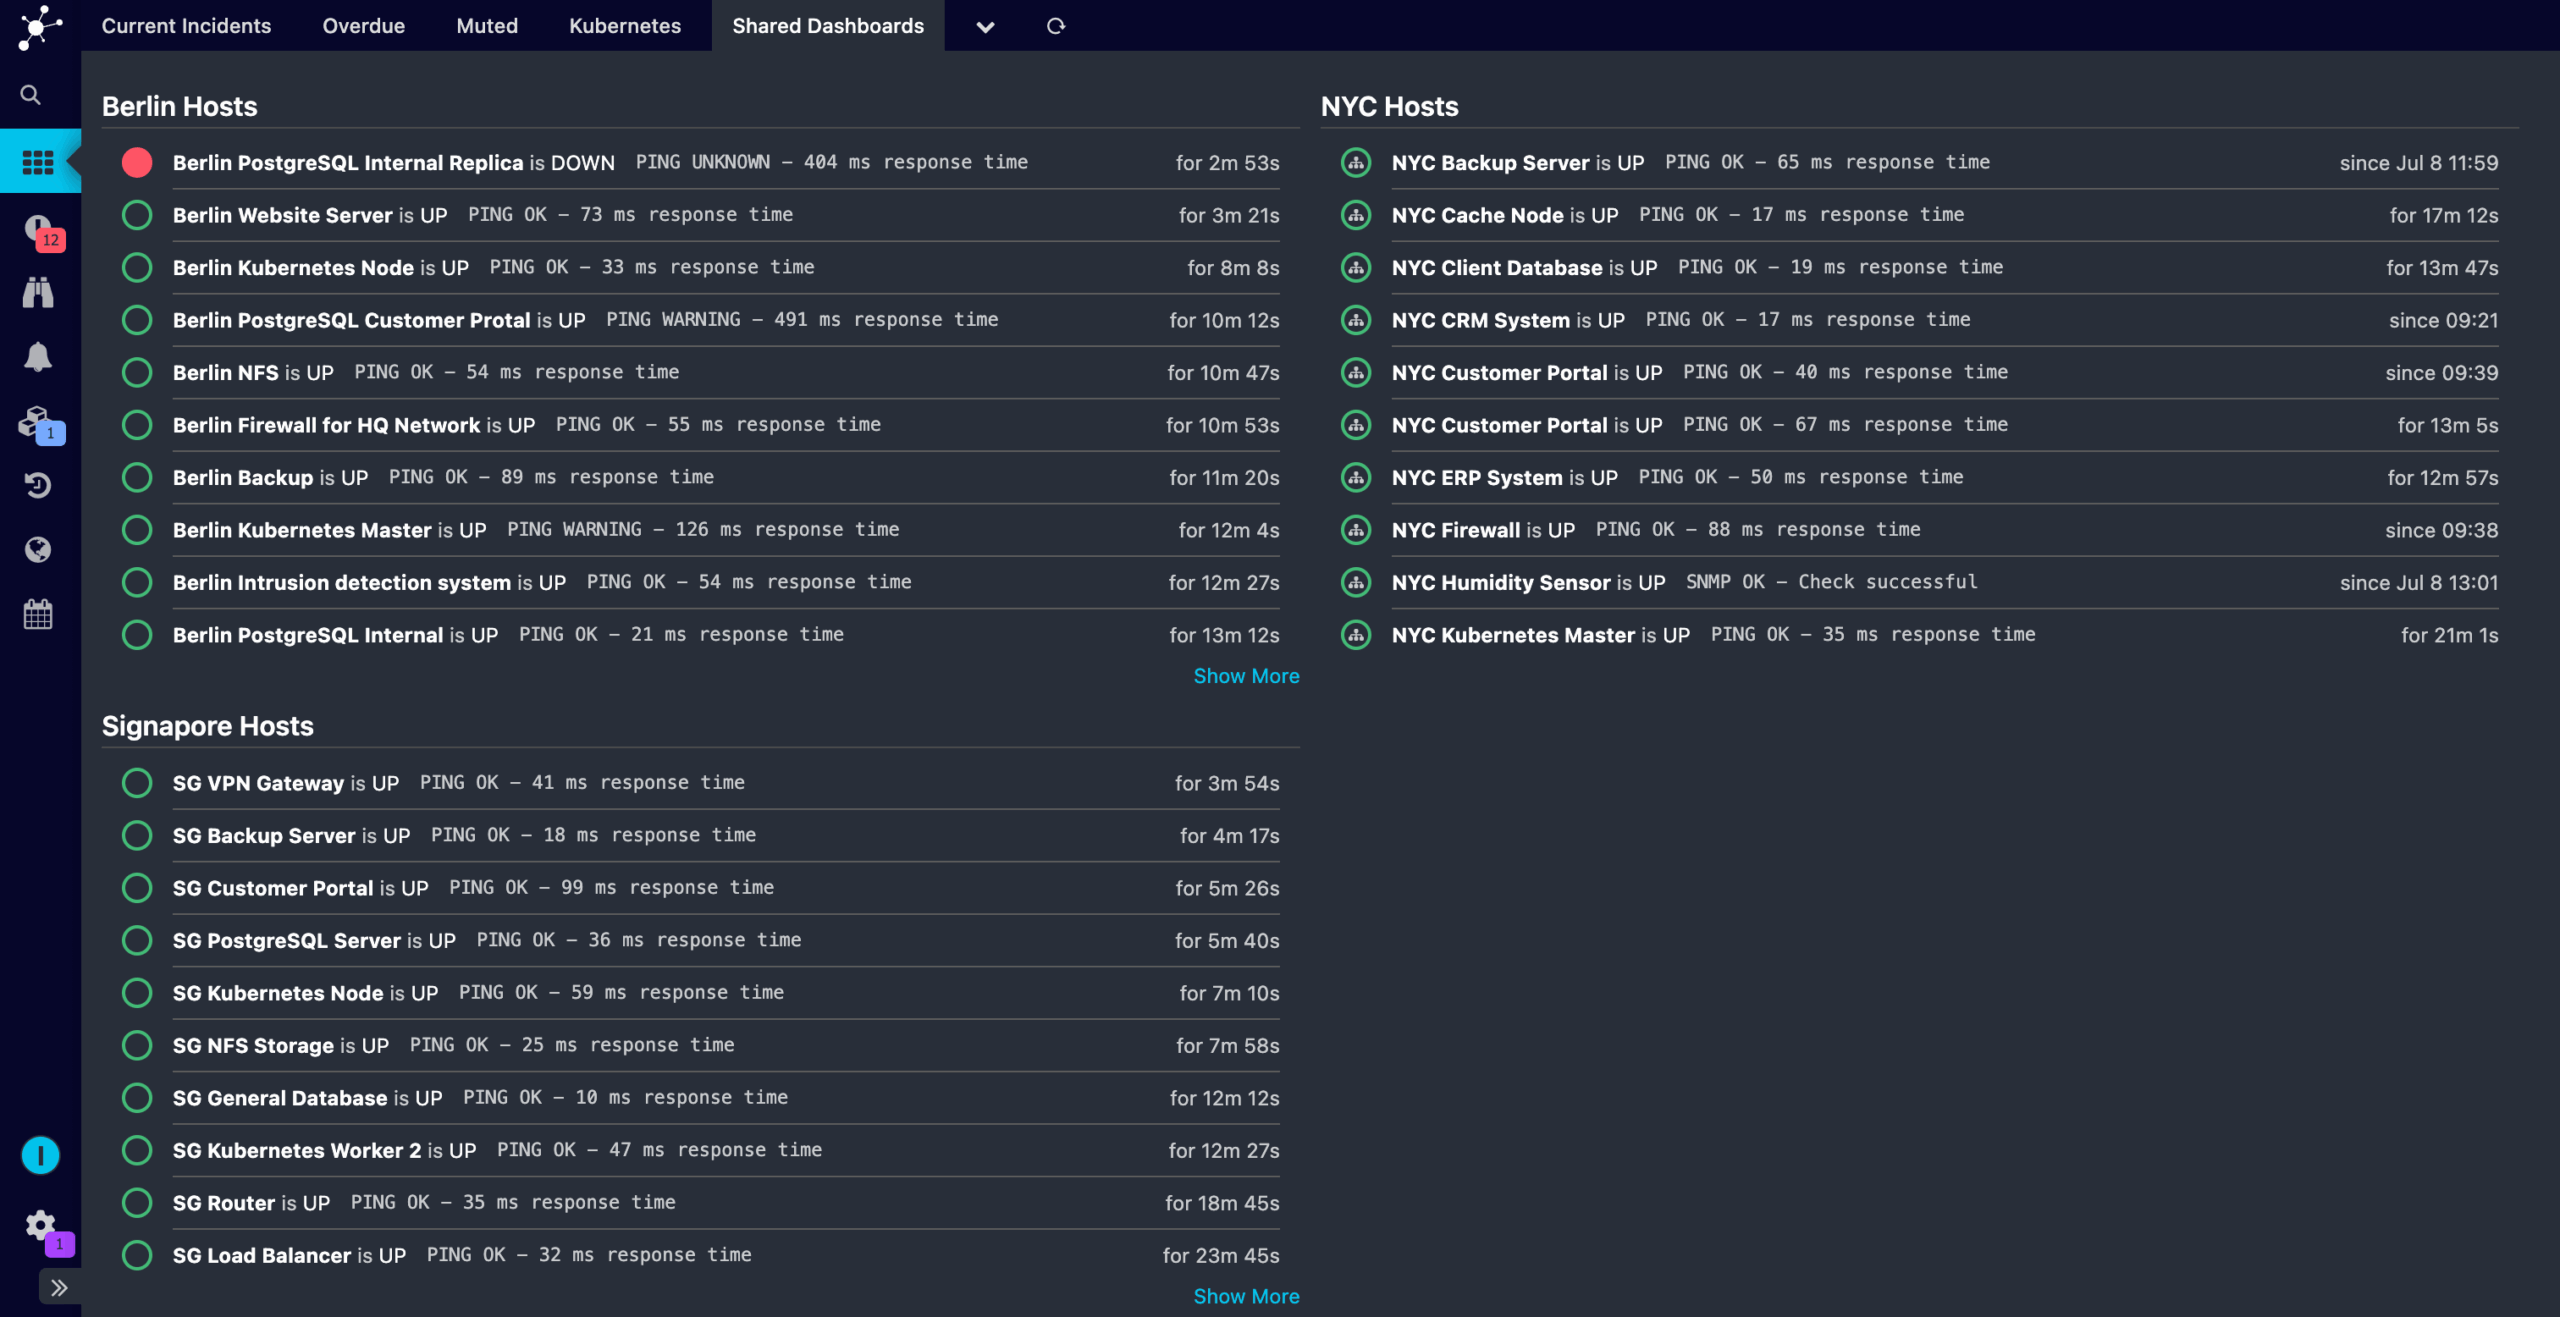
Dashboard Sharing – The Hard Way
Current Limitation: Dashboard Sharing Not Yet Supported Unlike menu items, dashboards in Icinga Web 2 currently can't be shared across users. This is something we will implement in future versions,...
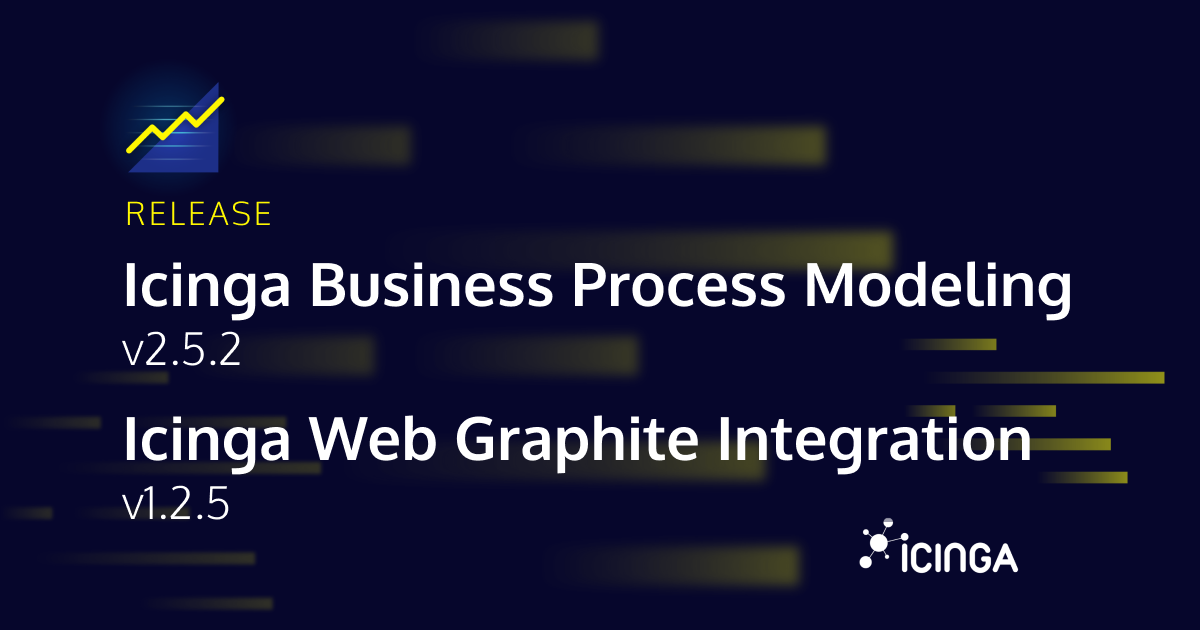
A little love for two old fellas – Icinga Business Process Modeling and Icinga Web Graphite Integration
Today is the day, we grant two products their long overdue maintenance. Maintenance always sounds boring, I hear you. But let me remind you that this also means we do and take care! And what this actually is all about: Icinga Business Process Modeling v2.5.2 Icinga...

Beyond PHP-FPM: Modern PHP Application Servers
For decades, PHP has powered the web using a simple model: process a request, send a response, then shut down. This model, especially in the form of CGI and PHP-FPM, is easy to understand but increasingly inefficient for modern web demands. The Traditional Model: CGI...
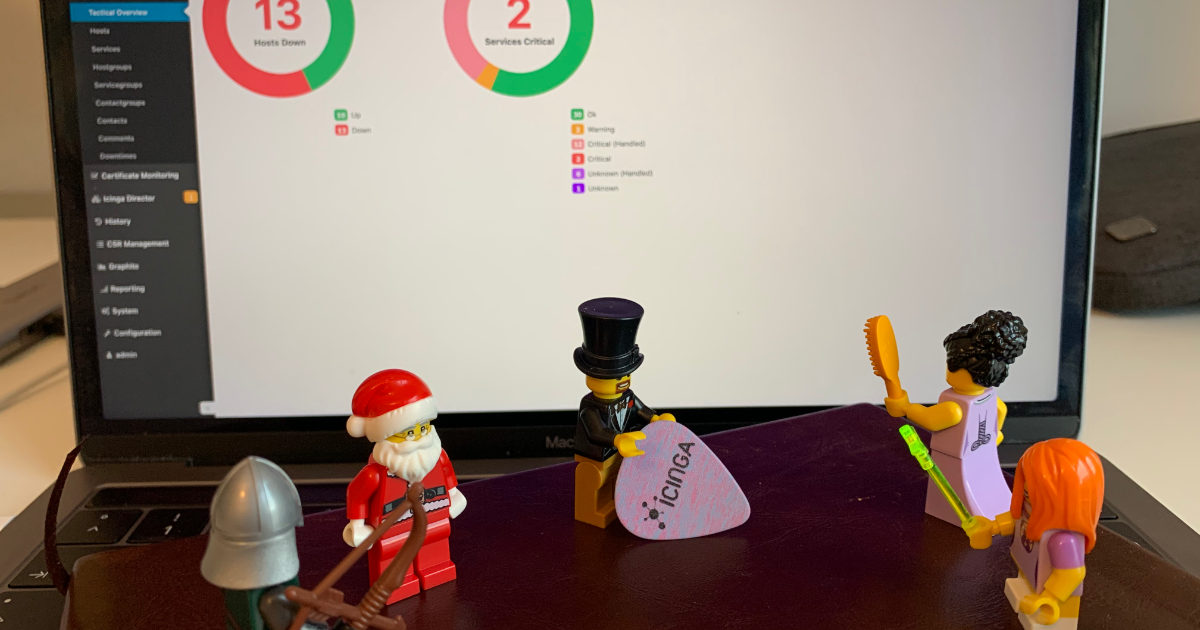
How to fetch data from Icinga Web
There are multiple ways to interact programatically with Icinga. Last week Henrik demonstrated how to connect to the Icinga 2 API through the Icinga 2 Console. Working with the Icinga 2 API is probably the most obvious way to interact with Icinga. Still, I would like...
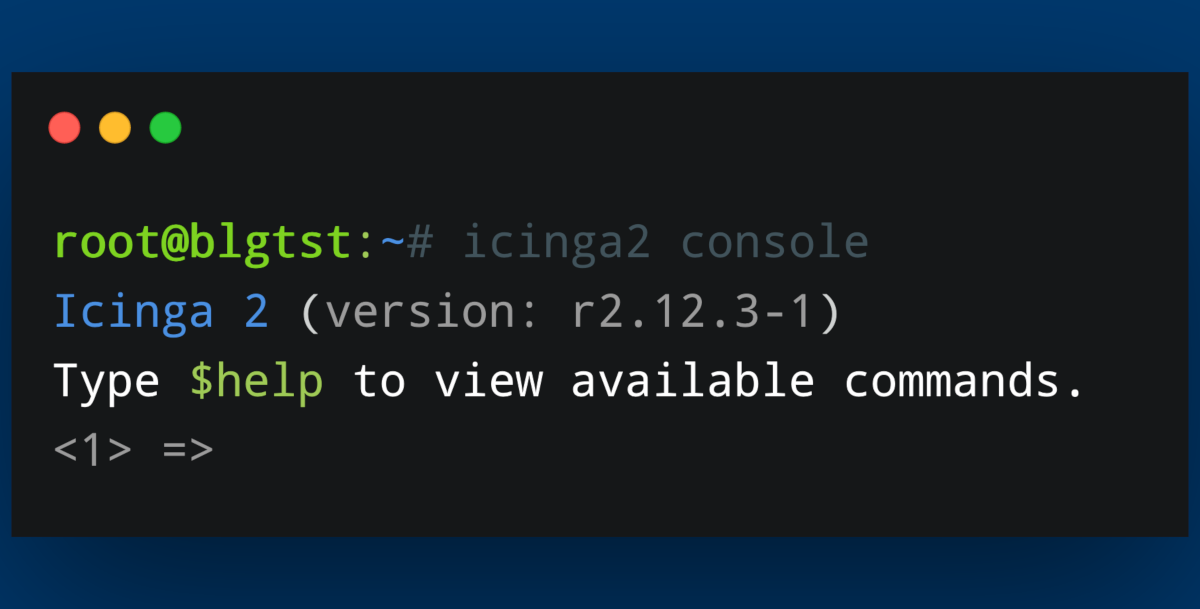
How to connect to the Icinga 2 API via the Icinga Console
Today I will show you a couple of small functions you can use with the Icinga Console. Using the Icinga Console can help with scripting in general and provides a quick and easy-to-use way of extracting information from your Icinga environment. We will take a look at...

Icinga 2 Config Sync: DIY Edition
Two weeks ago, Icinga 2 Config Sync: Behind the Scenes explained how the config sync in Icinga 2 works and how you can look behind the scenes. Today, we will put our knowledge from that post to the test and try to manually replicate the config sync. The most important...
Icinga for Windows – Hyper-V and Cluster Plugins Preview
Today we finally have great news to share for everyone using Icinga to monitor Hyper-V and Windows Cluster environments. For quite some time we've been working on multiple new plugins to provide better monitoring option for Hyper-V and Windows Cluster. The new plugins...
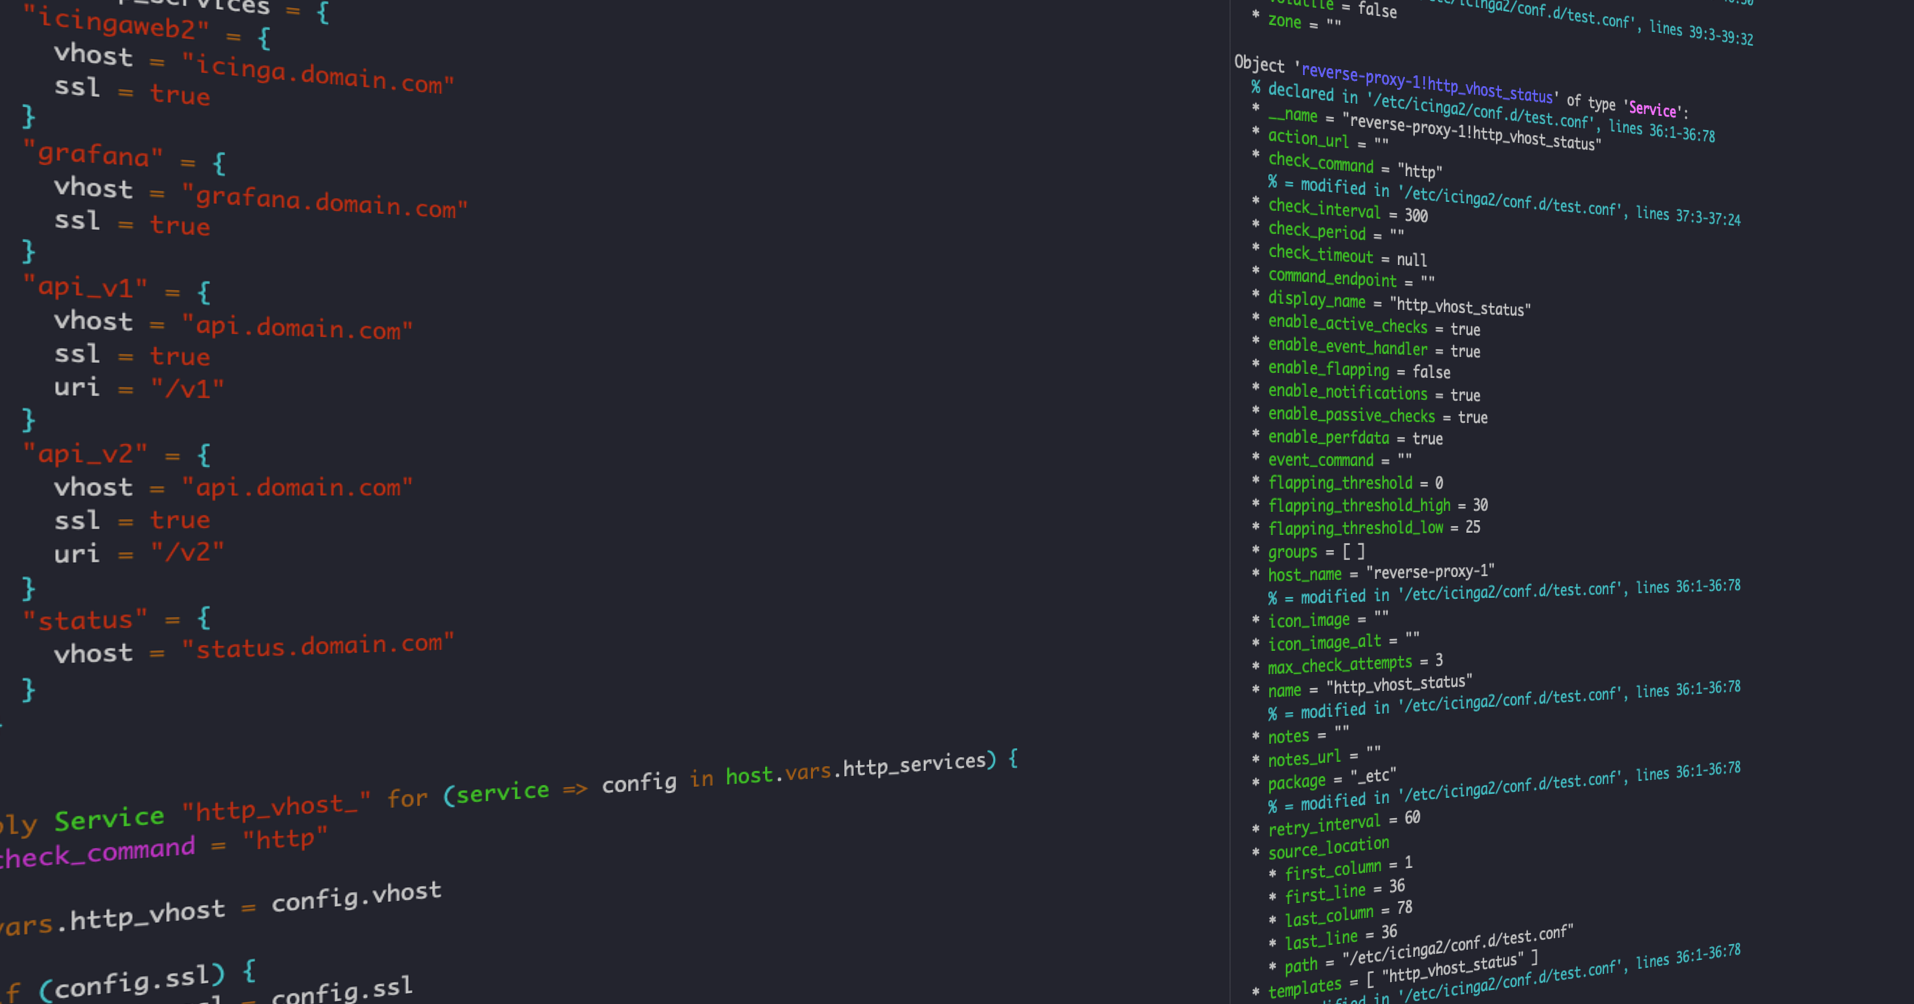
Icinga 2 Config Language (DSL): Advanced Apply Rules
As many users of Icinga don't know what the DSL has to offer, I'm going to show you how to use custom variables and apply for rules to make your life easier when writing configuration for your Icinga environment. Idea In this example we will use custom variables on a...

Icinga 2 Config Sync: Behind the Scenes
Today's blog post dives into the internals of Icinga 2 and will give you an overview how the config synchronization works internally. We will take a small cluster as an example and follow the configuration files through the synchronization mechanism. We assume some...
Releasing Icinga 2.11.8 + 2.12.3: Security and small improvements
Today we are releasing the 2.11.8 and 2.12.3 security & bugfix releases. Both versions contain the same changes. They resolve a security vulnerability with revoked certificates being renewed automatically ignoring the CRL, issues with high load on Windows...

How downtimes are displayed in Icinga DB Web
With the development of Icinga DB we not only rebuilt the core of how Icinga stores and reads monitoring data. With a complete rebuild of the monitoring module we took the chance and refined most aspects of the user interface as well. One aspect that got attention is...

Managing the Icinga Director with Ansible
This is a guest blogpost from Sebastian Gumprich from T-Systems Multimedia Solutions GmbH --- Our company is using Icinga for quite some time now to monitor our whole infrastructure and its customers infrastructure. We deploy many Icinga instances for different teams...

Subscribe to our Newsletter
A monthly digest of the latest Icinga news, releases, articles and community topics.
