
Monitoring as code means defining hosts, checks, thresholds and notification rules in version-controlled files, and deploying them through review and automated validation, the same way...
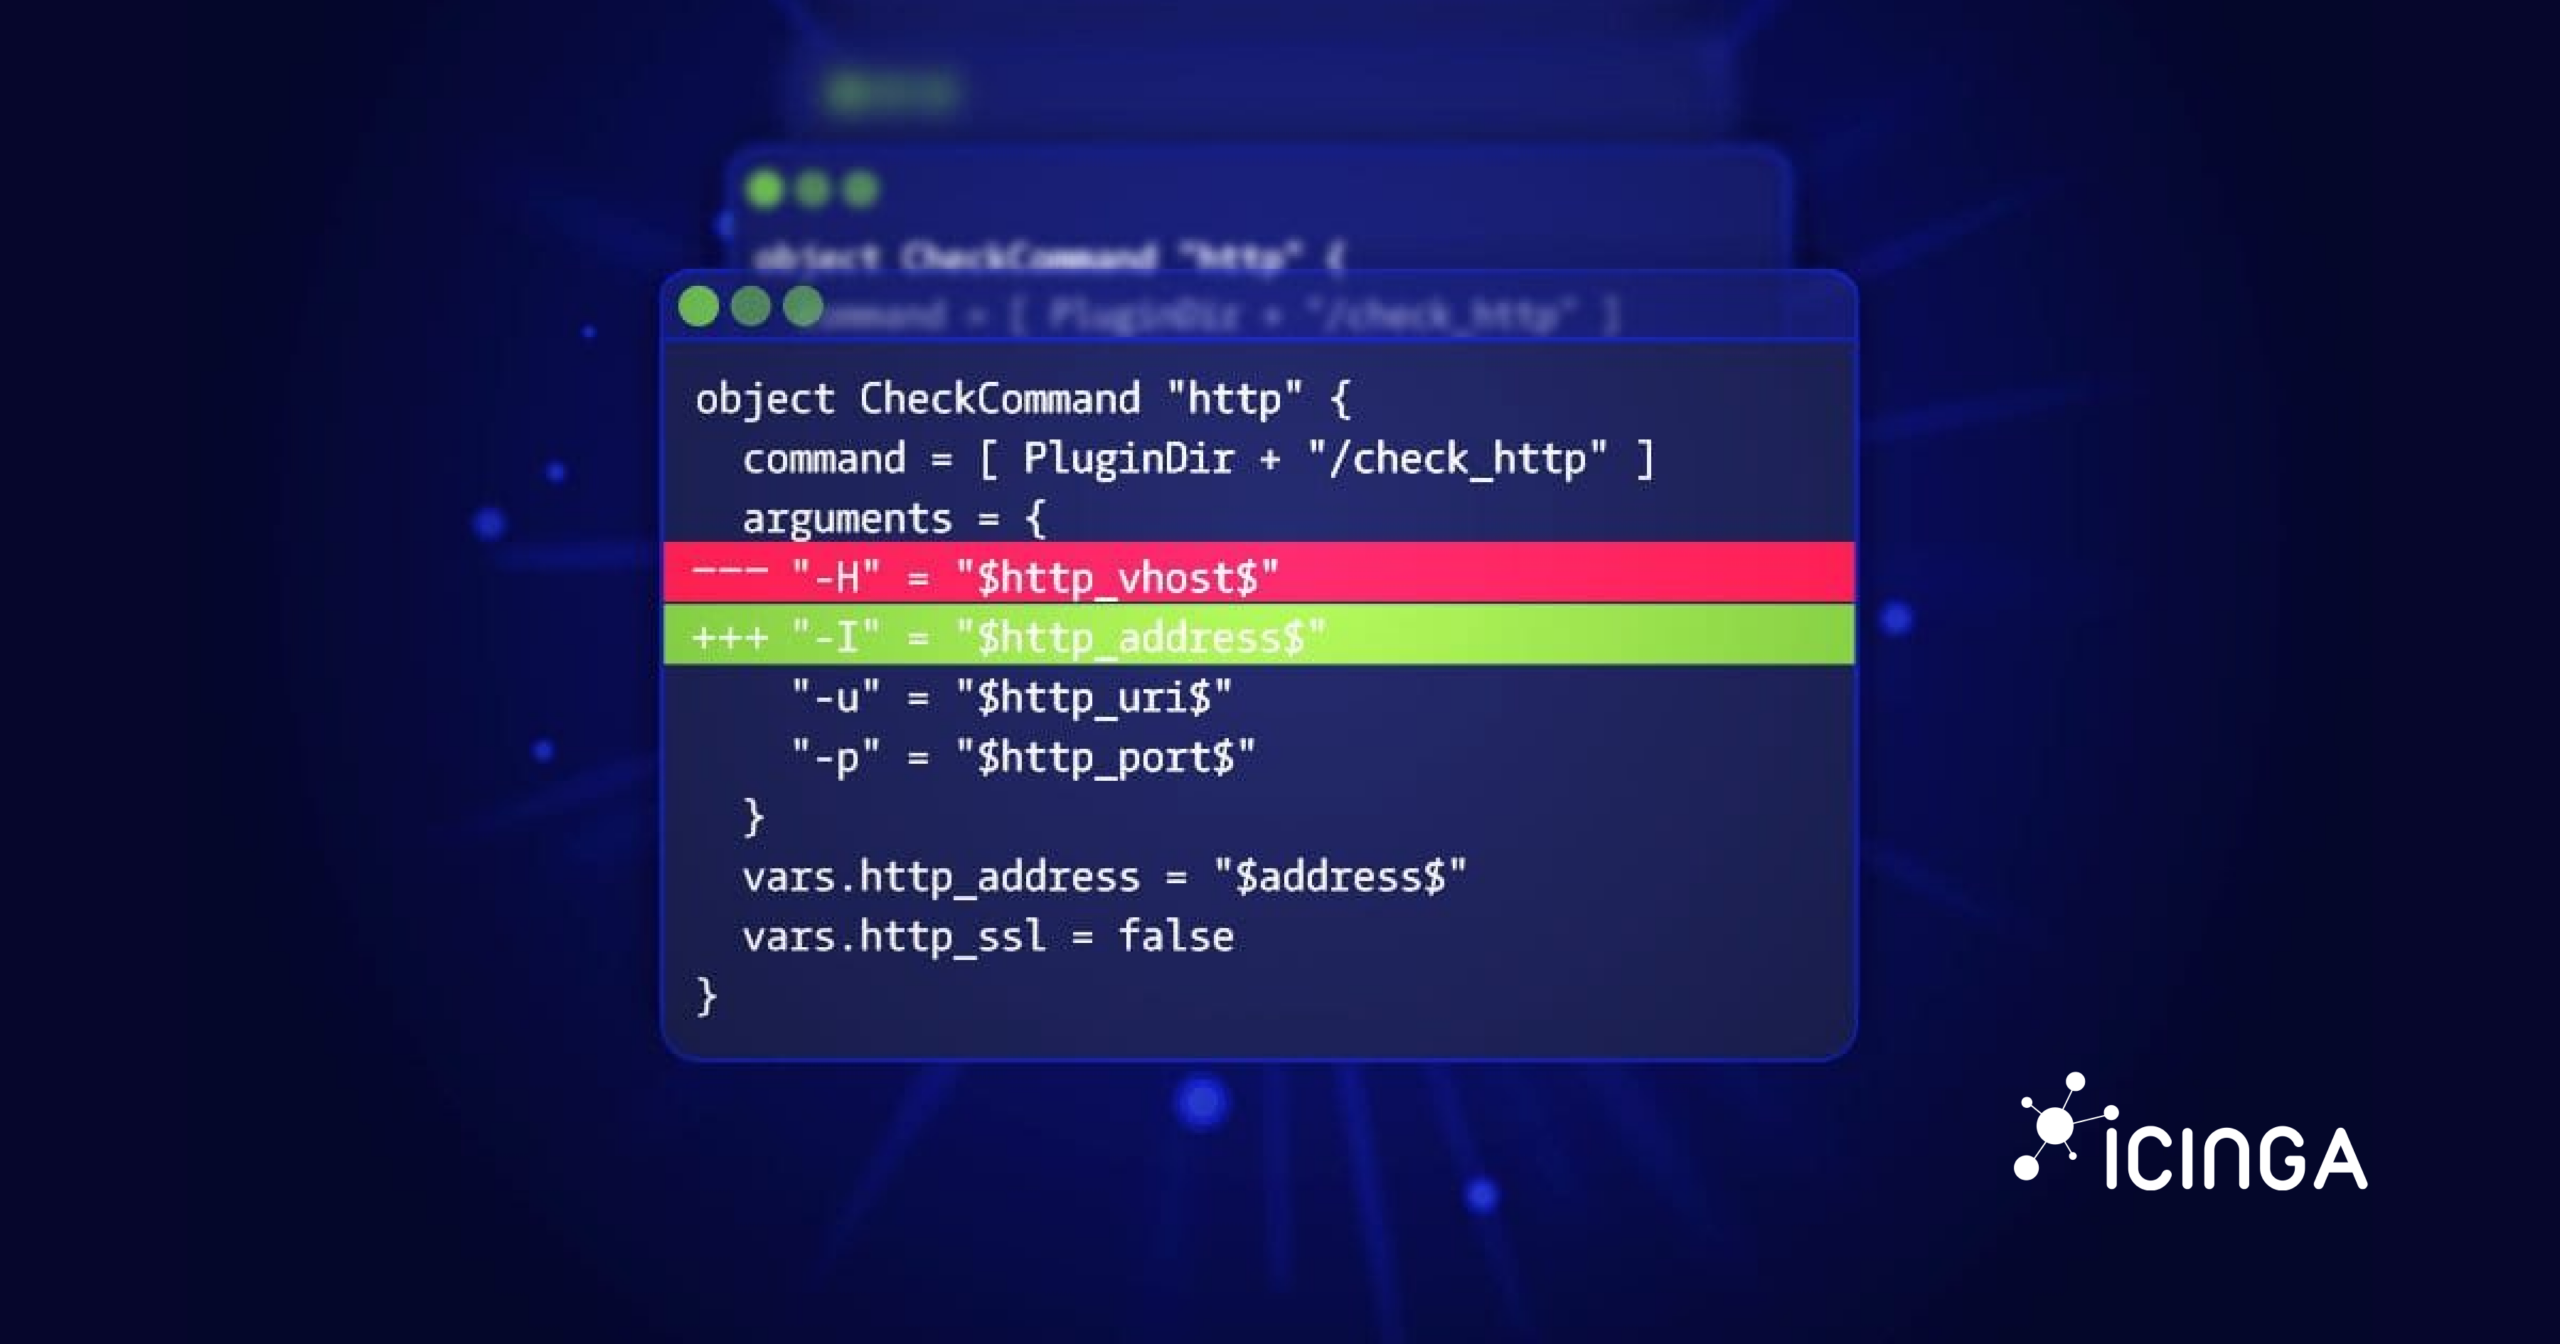
Monitoring as Code with Icinga: Approaches, Tools and Trade-offs
Monitoring as code means defining hosts, checks, thresholds and notification rules in version-controlled files, and deploying them through review and automated validation, the same way...

Icinga vs Checkmk: Setup, Cost, Flexibility and Support
Icinga and Checkmk are the two open-source monitoring tools that turn up most often on the same shortlist. Both monitor IT infrastructure, and on a feature list they look close to interchangeable. In practice they are built on different assumptions, and those...

Opsgenie End of Life: Where Open-Source Alerting Stands in 2026
Atlassian stops supporting Opsgenie on April 5, 2027. New sales ended on June 4, 2025, and data left in the platform after the support date gets deleted. If Icinga pushes alerts into Opsgenie today, that route has an expiry date, and so does every on-call rotation and...
Monitoring Docker Containers with Icinga
A container reporting "up" tells you the process is running, not that the workload is healthy - but that caveat is true of any service, on a container or a bare server. What makes containers their own monitoring problem is the layer around the process: per-container...

Icinga 2 Meets OpenTelemetry: Native Metrics Export in v2.16
The OTLPMetricsWriter is a new Icinga 2 feature available since v2.16 that exports check plugin performance data as OpenTelemetry-compliant metrics via the OTLP HTTP protocol. With a single configuration object, it connects Icinga 2 to any OTLP-compatible backend like...

How to Migrate an Icinga 2 Master in a High Availability Setup
Moving an Icinga 2 master to a new machine requires careful preparation, especially in a master-to-master high availability setup. In production environments, such migrations are often part of broader infrastructure changes, platform standardization, or long-term...
Nagios Alternatives: Why Icinga Is the Strongest Choice
Introduction Nagios has long been a trusted name in IT monitoring. Its plugin-based architecture and long-standing community have made it a stable choice for organizations of all sizes. However, IT infrastructures have changed dramatically in the last decade. With...

How to check CPU usage on Linux
When your Linux system feels sluggish, one of the first things to investigate is the CPU usage. The CPU (Central Processing Unit) is the brain of your machine, and if it’s overloaded, everything else slows down. In this guide, you’ll learn different ways to Linux...

Hybrid IT Infrastructure Management: Tools, Challenges and Best Practices
Hybrid IT infrastructure management is the practice of running on-premises systems, private cloud and public cloud resources as one environment, with shared monitoring, automation and security policies. Most teams manage it centrally with a layered toolchain:...
Monitoring Automation with Icinga Director – Simplify Configuration Management
Automating the monitoring process for a huge amount of servers, virtual machines, applications, services, private and public clouds is a main driver for users when they decide to use Icinga. In fact, monitoring large environments is not a new demand for us at all. We...

Icinga Package Repository Key Rotation, 2024
Icinga uses it's own repositories to distribute installation packages for the Icinga software. Today, we're announcing the rotation of the GPG key used to sign our repositories and packages. Currently, our repository is signed with a 1024 bit DSA key. Key rotation is...

Icinga and NetBox Labs Partner to Automate Network Monitoring
One of the major strengths of Icinga is its capability to integrate with many other tools to automate and scale IT infrastructure monitoring. Today, we're happy to announce the certification of an integration between Icinga and NetBox. The solution was developed over...

Subscribe to our Newsletter
A monthly digest of the latest Icinga news, releases, articles and community topics.