Some time ago, we started research and development efforts to create components for Icinga aimed at monitoring Kubernetes environments. Over the past months, we have gained valuable insights into the platform and how we can monitor Kubernetes with Icinga efficiently.
While Icinga excels at classic infrastructure monitoring, with its DSL expressing what to monitor, especially for traditional and virtualized deployments, such as services on physical servers or virtual machines, the landscape has evolved with containerized deployments presenting a new set of challenges. With Kubernetes on top and its self-healing, load-balancing and scaling features, the configuration-centric approach cannot be directly applied, and we had to come up with something that aligns with the dynamic nature of Kubernetes.
Moreover, our monitoring scope extends beyond infrastructure to include Kubernetes itself, its workloads, and crucial metrics. Our approach involves combining, correlating, and responding to all these aspects, leveraging the Kubernetes API, which provides access to metrics, configuration details, desired and actual resource states, and health information.
Here is a quick overview:
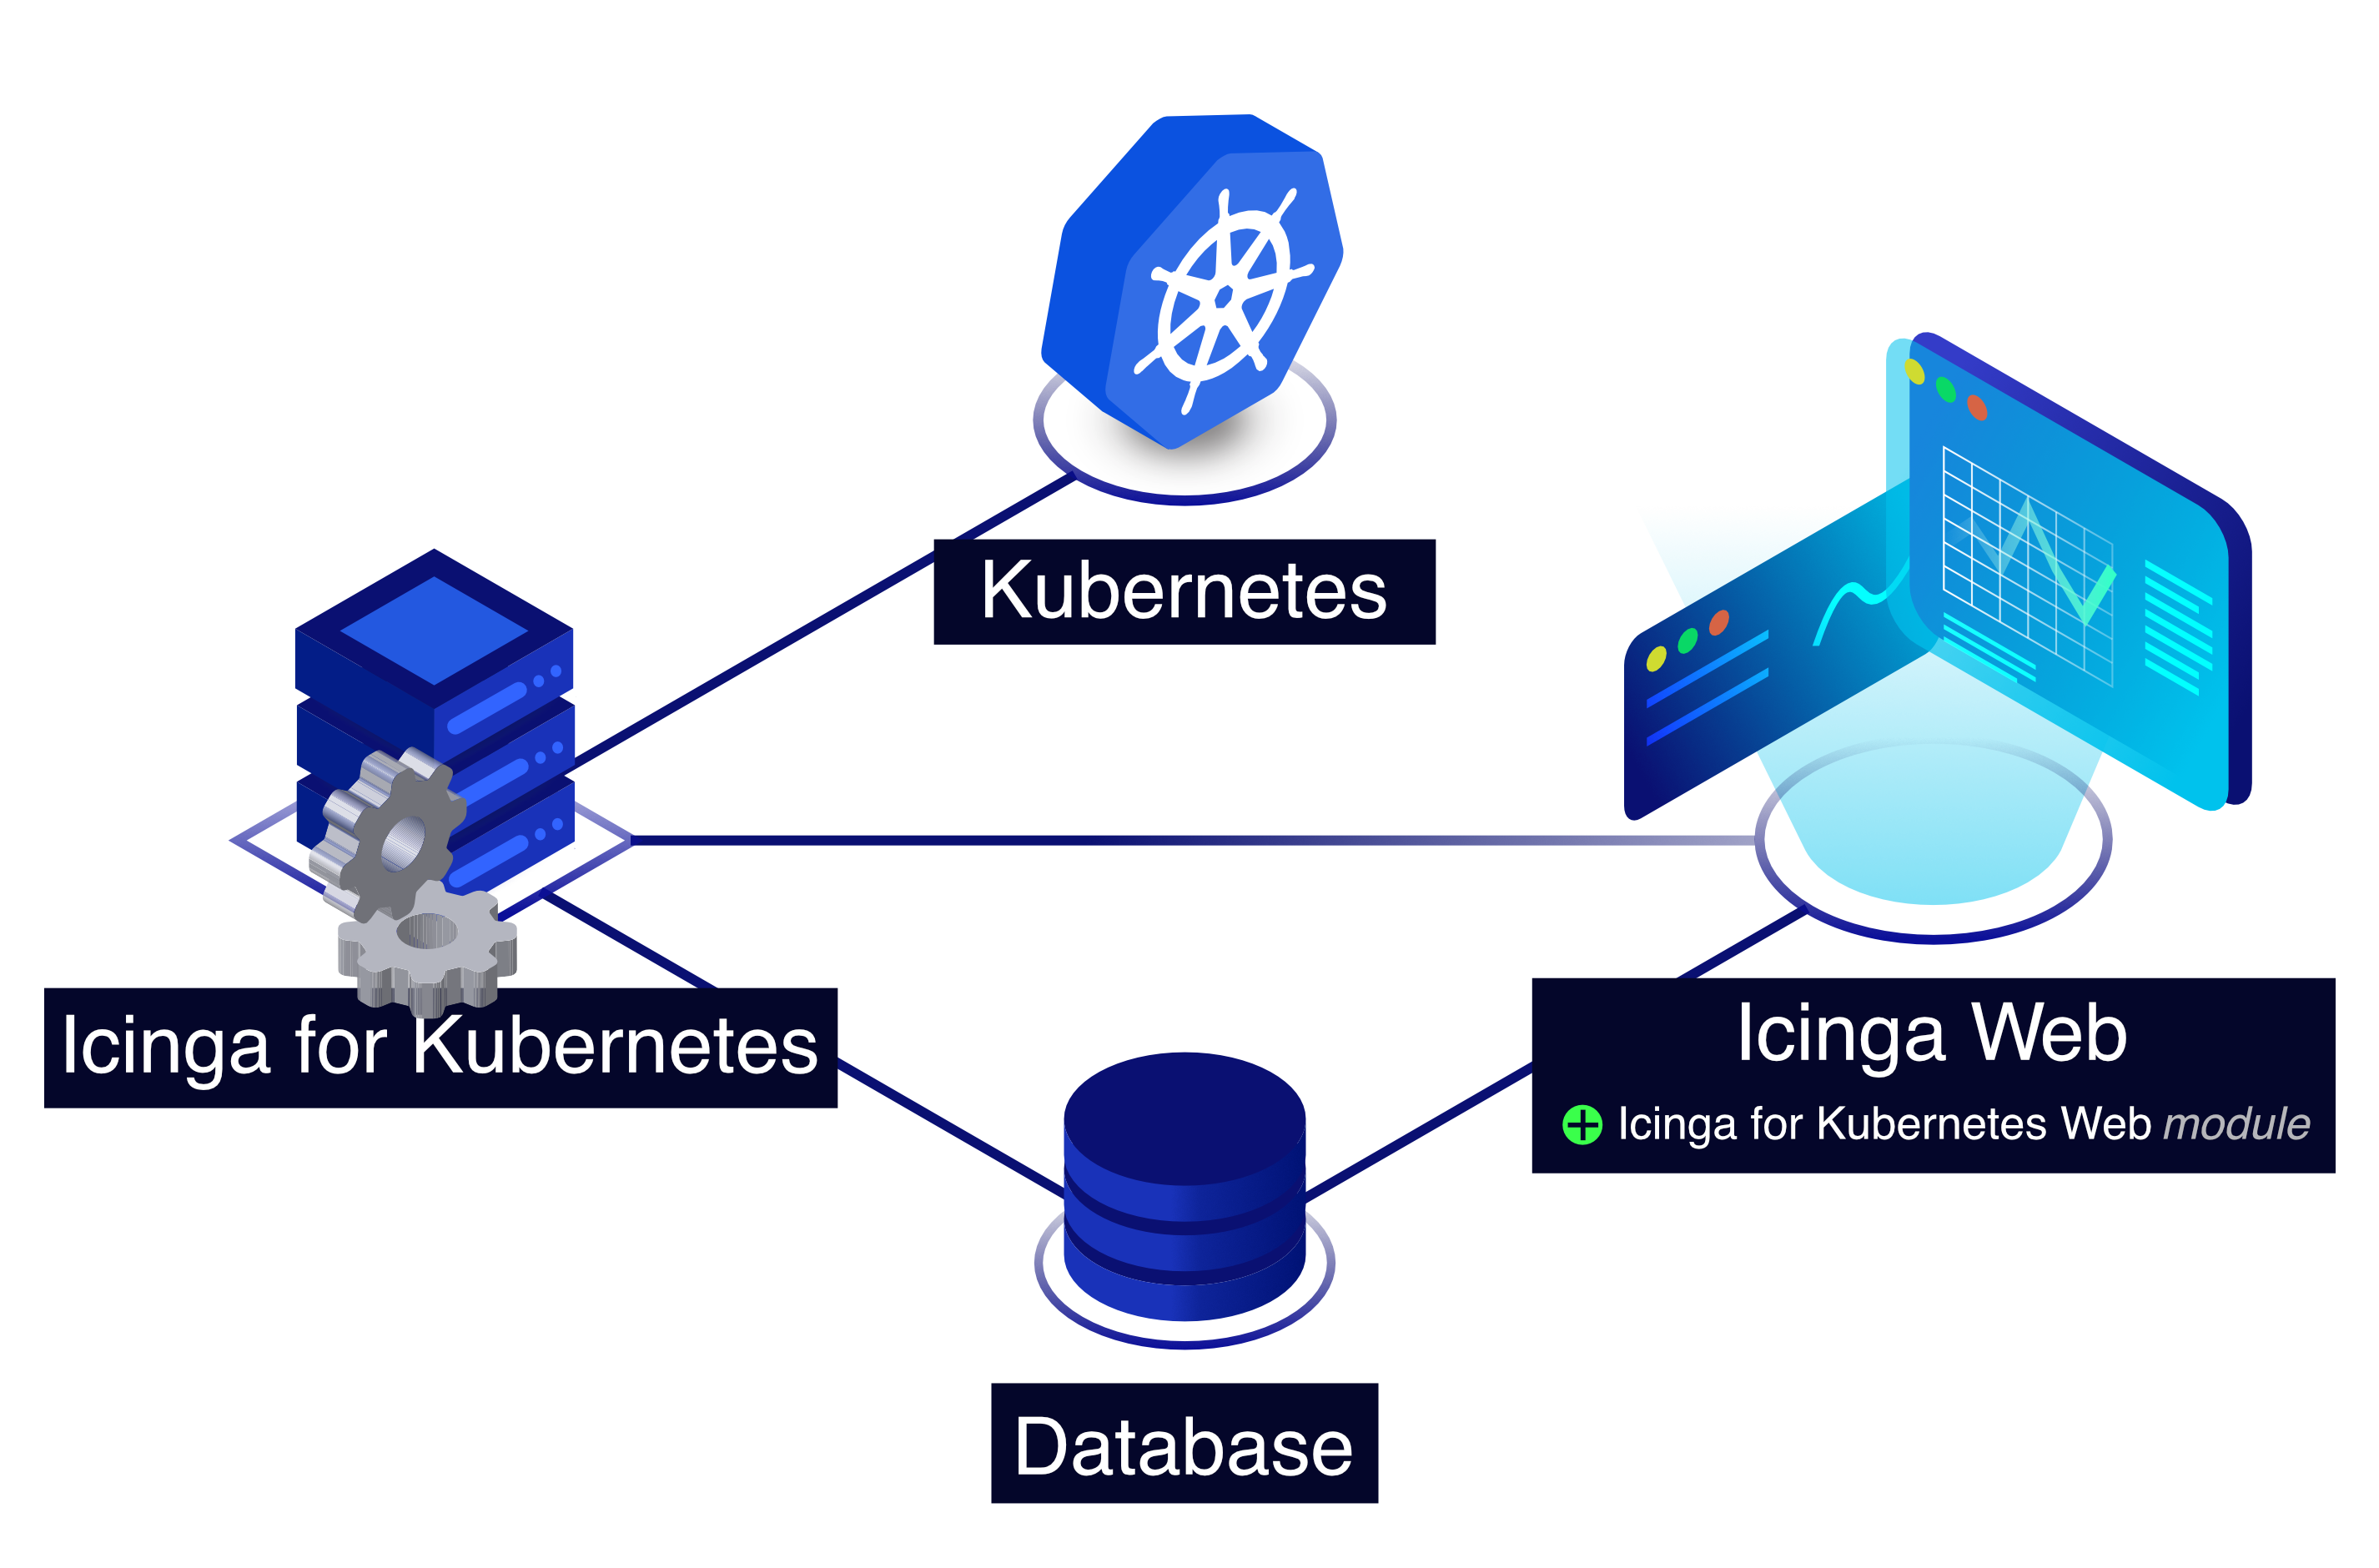
Architecture
Icinga for Kubernetes is a set of components for monitoring and visualizing Kubernetes resources, consisting of
- the Icinga for Kubernetes daemon, which uses the Kubernetes API to monitor the configuration and status changes of Kubernetes resources synchronizing every change in a database, and
- Icinga for Kubernetes Web, which connects to the database for visualizing Kubernetes resources and their state.
Get Started
Any of the Icinga for Kubernetes components can run either inside or outside Kubernetes clusters, including the database. For running Icinga within Kubernetes use our Helm charts to provide a ready-to-use Icinga stack:
helm repo add icinga https://icinga.github.io/helm-charts
helm repo update
kubectl create namespace icinga
helm install icinga-stack \
--namespace icinga \
--set icinga2.config.ticket_salt.value=CHANGE-ME \
--set icingaweb2.auth.admin_password.value=CHANGE-ME \
--set global.api.users.director.password.value=CHANGE-ME \
--set global.api.users.icingaweb.password.value=CHANGE-ME \
--set global.databases.director.username.value=CHANGE-ME \
--set global.databases.director.password.value=CHANGE-ME \
--set global.databases.icingaweb2.username.value=CHANGE-ME \
--set global.databases.icingaweb2.password.value=CHANGE-ME \
--set global.databases.icingadb.username.value=CHANGE-ME \
--set global.databases.icingadb.password.value=CHANGE-ME \
--set global.databases.kubernetes.username.value=CHANGE-ME \
--set global.databases.kubernetes.password.value=CHANGE-ME \
icinga/icinga-stack
We also provide ready to use packages for various Linux distributions, for those of you who do not want to deploy Icinga for Kubernets via Helm.
-
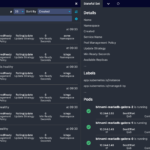
- Stateful Sets
-
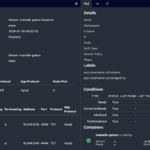
- Service Details
-
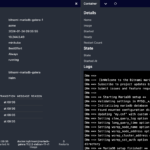
- Pod Details
Today we are releasing a first version of the components you can use to keep an eye on your Kubernetes resources and their state. For future versions, we will be working on correlating metrics, displaying charts and sending notifications. We are looking forward to your feedback, and you can collaborate on the respective GitHub pages of the Icinga for Kubernetes daemon and Icinga Kubernetes Web components. Looking for the full overview? Check out our Kubernetes Monitoring Solution Page to learn more.