Today we’re announcing the general availability of Icinga DB Web v1.1.0.
You can find all issues related to this release on our Roadmap. Please make sure to also check the respective upgrading section in the documentation.
Things You Eagerly Waited For

Keyboard enthusiasts: Behold! You can now navigate with your arrow keys in lists. Plus multiple selections with Shift! 🤩 Also the host- and servicegroup-grid views some might have missed are now integrated. Oh and, a check’s output and its executed command are now copiable with a single click. But be sure to also try Ctrl/Cmd + a in a list! 😅 And those already using Icinga Web v2.12, can now enable the Content-Security-Policy functionality and don’t need to worry about a skewed UI in Icinga DB Web. Speaking of a skewed UI, combining Icinga DB Web with PHP 8.2 doesn’t show errors anymore.
- Keyboard Navigation for Lists #106
- Host- and Servicegroup grid views #221
- “Copy to Clipboard” functionality #677
- CSP Compliancy #817
- Support for PHP 8.2
Checks, Present and Future
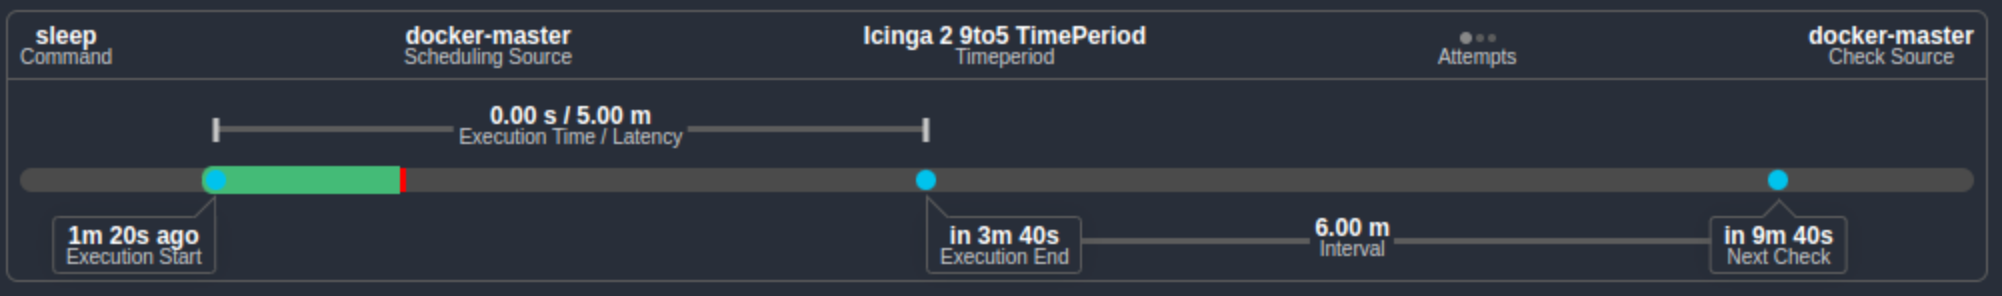
Some of you love the new widget we’ve introduced here regarding a check’s execution details. With this release we push it even further, as it is animated now! It even shows you whether a check is still running or waiting for it. The first is of course most noticeable with long-running checks. But wait, there are also really practical things, like the now shown time-period and the retry interval in case it’s still a soft-state.
- Visualize that a check is currently running #493
- Display retry interval when in soft state #684
- Display TimePeriod in detail view #109
Improved State Representation

The monitoring module shows the reachability of hosts and services as a separate state, if at all. (For service-to-service dependencies it is missing) In lists, this has the effect that the real state of the check is not visible. With Icinga DB Web v1.0, we didn’t do much better, as the reachability wasn’t visible at all in lists. Now it is, and it’s handled like other things like objects in downtime. (i.e. An icon is shown in the state visual) We did a similar thing for UP/OK checks that are in downtime, as they also got an icon there now.
- Unreachable hosts not shown as such #802
- Symbol doesn’t show that Host/Service is in Downtime when it’s okay #706
Find What You Look For

Anyone who has multiple services with an asterisk in the name can now sigh with relief: You can now search for them without getting false-positives. Though, this has a significant downside as anyone who used asterisks as wildcards in equal/unequal filters (=/!=) won’t find anything now. They have to use the new operators for like/unlike instead. (~/!~)
Users of Icinga Web v2.12 and Icinga DB Web v1.0 might have noticed this change already. I’m really sorry that we didn’t mention this earlier. The migration widget you already hatelove will of course assist there. But we know there is a more effective solution required for this, so the next release of Icinga Web in version 2.12.1 will include proper migration procedures.
Another enhancement is that it is now possible to consistently search for parts of a display name everywhere, using a view’s quick-search. Using the global search, Icinga DB Web will also try to match hosts and services by comparing the IP(v4|v6)Address now.
- A service with a literal
*in the name is ignored by the multiselection detail #693 - find nothing of hosts when do global searching based on display name or address #690
Reduced Waiting Time

Performance is also enhanced quite a bit. Filters were previously not as efficiently applied as possible. This resulted in way too expensive queries and impacted load times negatively. The queries are now less complex and any filters targeting related objects (like groups and variables) don’t slow load times down as much. The same applies to actions applied to multiple objects. Though, in this case the communication with the Icinga 2 API was inefficient. If you issue actions on hundreds or thousands of objects you will now notice the effects earlier.
- IcingaDB – poor performance when using custom variables in the queries #711
- Improve performance of Icinga 2 API commands processed in bulk #721
Automation, Working
![]()
Icinga DB Web’s API is still not in a state to my liking, but it’s at least on par now with what the monitoring module provides. What actions you can issue in the UI, can now also be easily done with e.g. cUrl on the commandline. Be sure to check out the documentation on this. Retrieving hosts or services as JSON now includes the latest information known about them. Previously, the results didn’t contain the same data what the UI showed.
- JSON generated contains stale / not up-to-date information #844
- Make command actions easier to use with curl #863
Security, Restored

Some security related fixes are also included. Using the previously mentioned way to access hosts or services as JSON, it was possible to access a check’s commandline. Since some checks require sensitive information to run, this data is hidden in the UI and only accessible for user’s with the appropriate permission. Now only those permitted users will be able to retrieve the data in JSON/CSV reports. Then, authenticated users not permitted to access the module configuration were able to access the Redis configuration by directly visiting the respective URL. If such a user does this now, access is forbidden.
- Avoid leakage of state.check_commandline to restricted users #784
- Users with General Module Access can View Redis Configuration #679
Embrace The Future, Already
I know some of you still didn’t move over to Icinga DB or still run both backends in parallel. This release makes it easier to run the monitoring module and Icinga DB Web in parallel. Not granting access to monitoring but Icinga DB Web, will now be presented to the user as if only Icinga DB Web is enabled. This way some users can exclusively use monitoring and some Icinga DB Web. The latter will hopefully grow in numbers!