One of the pillars of Icinga is integrations. With it’s open APIs and various extensions, Icinga is capable of integrating seamlessly into your existing infrastructure. Today I want to give you an introduction to our VMware integration and share some details about the latest release. The Icinga Module for vSphere® is an Icinga module dedicated to collecting, monitoring and visualizing data from your VMware environment.
System administrator and engineers who run and maintain VMware hypervisors compulsorily face the challenge of monitoring the underlying Host Systems, Datastores and also the Virtual Machines. While there are different solutions to receive alerts and get insights, none of them integrate well with other parts of the infrastructure. Icinga aims to solve this issue by combining all parts under one roof.
How it works
The Icinga Module for vSphere® connects to one or multiple VMware vCenter or VMware ESXi™ Servers. The module does not rely on vendor libraries, instead it connects directly to the relevant APIs. Data is replicated from VMware and stored within a dedicated database which allows reliable and fast monitoring. Additionally, the collected data is visualized within the standard Icinga web interface so you don’t need to switch between different monitoring products. Icinga leverages the information to simplify common monitoring tasks, such as alerting and forwarding data to time series databases.
What’s included
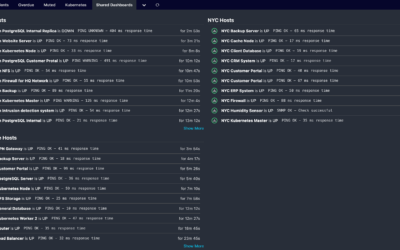
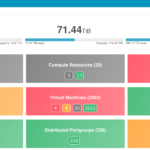
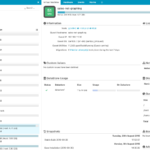
At first glance you get an overview over all Host Systems, Virtual Machines and Datastores. This includes information about CPU and Memory usage, but also details about used/available data storage. Providing a rough overview is important to get started and identify what is actually configured and running. In detail there is much more to discover.
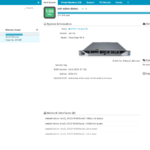
For each Host System you get the virtualization details: The hostname, how many VMs are running on that machine, the internal path and the hypervisor and API version. The module displays information about the hardware as well, such as the Vendor and Model, Service Tags and even the Bios version. Network interfaces with their current state are shown as well as details about the CPUs and their utilization.
Next, you get an overview over all Virtual Machines, with many detailed information: The operating system, IP address, resource utilisation, configured datastore and disks are some of them. Additionally you get an overview over available snapshots and network interfaces. The links to the VMRC, HTML5 UI and MOB interface enable you to quickly connect directly to the machine and do your maintenance tasks. From the Virtual Machine details you can jump directly to related Events and Alarms that have been generated by VMware.
-

- Overview
-
- Virtual Machines
-
- Host Systems
-
- Datastores
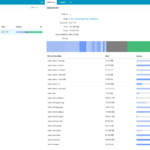
For each VMware Datastore you get a detailed overview over the VMs using it. Additionally you see insights about the available capacity and the allocation by each VM.
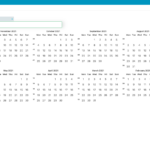
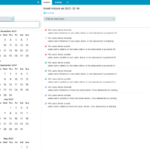
While there’s an overview of related events and alarms for each Host Systems, Virtual Machine and Datastore the Icinga Module for vSphere® provides an overview over all events as well. The overview is a calendar that displays the amount of events per day. The view can be filtered by different event types. Each day within the calendar can be selected to see the actual events. Optionally, you can switch from the calendar view to a table view.
-
- Event Calendar View
-
- Event Detail View
In fact, there are so many more details that this module provides, such as information about Sensors and PCI devices. However, listing every detail here probably goes too far.
Monitoring Automation and Integration
While getting overviews and insights is a big win, the Icinga Module for vSphere® goes further and integrates into your existing Icinga monitoring. The collected data is used to automate detailed monitoring and embeds into the Icinga web interface.
If you’re using the Icinga Director you will see a new Import Source “VMware vSphereDB”. This allows you to import information about Host Systems, Virtual Machines, Compute Resources and Datastores directly into the Director. Additionally, the vSphereDB module can hook into the Icinga monitoring module. This allows to show context information related to your virtualization infrastructure next to each monitored Host.
Releasing Version 1.2
The latest release of the Icinga Module for vSphere® comes with a completely new integration for InfluxDB. The module is now capable of sending metrics directly to InfluxDB, where one or multiple InfluxDB endpoints can be added. Metrics are send with a resolution up to 20 seconds.
Additionally we changed the behaviour of the daemon which is responsible for collecting data from vCenter and ESXi™. The new architecture allow asynchronous and spawns one process for each connected VMware endpoint. Further, the new design of the Daemon utilizes less memory and is able to poll even faster than previous versions.
We include many UI improvements with this release. Compared to previous versions we restructured the view of Host Systems and Virtual Machine information. Additionally we added the HA state, Network interfaces and a picture of the hardware vendor model for Host Systems. Custom values are now collected for Host Systems and Virtual Machines, the information may be used within the Icinga Director Import Source as well.
Get Started
Getting started with the Icinga Module for vSphere® is fairly easy, we provide all required steps within the Installation Documentation.