Today we are proud to announce the official release for Icinga for Windows v1.2.0! This includes v1.2.0 of the Icinga PowerShell Framework and v1.2.0 for the Icinga PowerShell Plugins. We collected plenty of feedback during the past months from our world-wide user base and focused on stability and usability in this release, but also added several new features!
New Icinga Plugins
Most importantly, we added three new plugins to our Icinga PowerShell Plugins repository:
- Invoke-IcingaCheckTimeSync: Allows to compare local machine time with a time server to check for possible time missmatch
- Invoke-IcingaCheckScheduledTask: Allows to check the current state for a list of provided scheduled tasks
- Invoke-IcingaCheckDiskHealth: Allows to check for several disk Performance Counters and the disk health in general
Improved Performance Counter Usage
Windows Performance Counter deliver many in-depth details about the current Windows state and other services. To ensure the usability is increased even further, we added several new Cmdlets to help with the management. In addition the Show-IcingaPerformanceCounterCategoriescommand now supports a -Filter argument with which you can do a wildcard lookup for specific categories only.
Show-IcingaPerformanceCounterCategories -Filter '*Processor*';
Processor
Hyper-V Hypervisor Logical Processor
Hyper-V Hypervisor Root Virtual Processor
Hyper-V Hypervisor Virtual Processor
Hyper-V Worker Virtual Processor
Per Processor Network Interface Card Activity
Per Processor Network Activity Cycles
Processor Information
Show-IcingaPerformanceCounterInstances
This command will print all available instances for a Performance Counter path, which is helpful for troubleshoting and testing.
Show-IcingaPerformanceCounterInstances '\Processor(*)\% processor time';
Name                           Value
----                           -----
_Total                         \Processor(_Total)\% processor time
0                              \Processor(0)\% processor time
1                              \Processor(1)\% processor time
2                              \Processor(2)\% processor time
3                              \Processor(3)\% processor time
4                              \Processor(4)\% processor time
5                              \Processor(5)\% processor time
6                              \Processor(6)\% processor time
7                              \Processor(7)\% processor time
Of course we also print the full path to this specific counter in addition!
Show-IcingaPerformanceCounterHelp
Have you ever wondered how to interpret a certain Performance Counter and how the value can/should be used? With this command you can print the help for a Performance Counter and make things a lot easier:
Show-IcingaPerformanceCounterHelp '\Processor(*)\% processor time';
% Processor Time is the percentage of elapsed time that the processor spends to execute a non-Idle thread. It is calculated by measuring the percentage of time that the processor spends executing the idle thread and then subtracting that value from 100%. (Each processor has an idle thread that consumes cycles when no other threads are ready to run). This counter is the primary indicator of processor activity, and displays the average percentage of busy time observed during the sample interval. It should be noted that the accounting calculation of whether the processor is idle is performed at an internal sampling interval of the system clock (10ms). On todays fast processors, % Processor Time can therefore underestimate the processor utilization as the processor may be spending a lot of time servicing threads between the system clock sampling interval. Workload based timer applications are one example  of applications  which are more likely to be measured inaccurately as timers are signaled just after the sample is taken.
Test-IcingaPerformanceCounterCategory
Last but not least we added a test command if a certain Performance Counter category exist. This is required as on some machines certain counters might not exist. For plugin developers this means there is now an integrated solution available to perform code execution tasks only if certain categories are available.
Test-IcingaPerformanceCounterCategory 'Processor';
True
Improved Exception Handling
As Windows machines are not all configured identical and sometimes certain WMI/CIM objects are not present or even Performance Counter categories missing, we invested a lot of time re-writing certain core functionallity. Instead of returning huge stacktrackes within Icinga Web 2, we are trying to catch most of the issues and return proper error messages. If for example your user is not having permission to access certain WMI objects, you are now greeted with a proper error message, telling you what do to:
[UNKNOWN]: Icinga Permission Error was thrown: CimInstance: Class: "MSFT_PhysicalDisk", Namespace: "root\Microsoft\Windows\Storage"
The user you are running this command as does not have permission to access the requested Wmi-Object. To fix this, please add the user the Agent is running with to the "Remote Management Users" groups and grant access to the WMI branch for the Class/Namespace mentioned above and add the permission "Remote enable". Further details can be found here: https://docs.microsoft.com/en-us/previous-versions/windows/it-pro/windows-server-2008-R2-and-2008/cc771551(v=ws.11)
In addition check commands generated with Get-IcingaCheckCommandConfig will now provide a proper error handling in case the Framework itself or a certain plugin is not installed.
**Note** Check-Commands generated starting with the PowerShell Framework v1.2.0 are *not* backwards compatible. If you create the configuration and import it into the Icinga Director, you will have to ensure every Windows machine has atleast the Framework version 1.2.0 deployed on it.
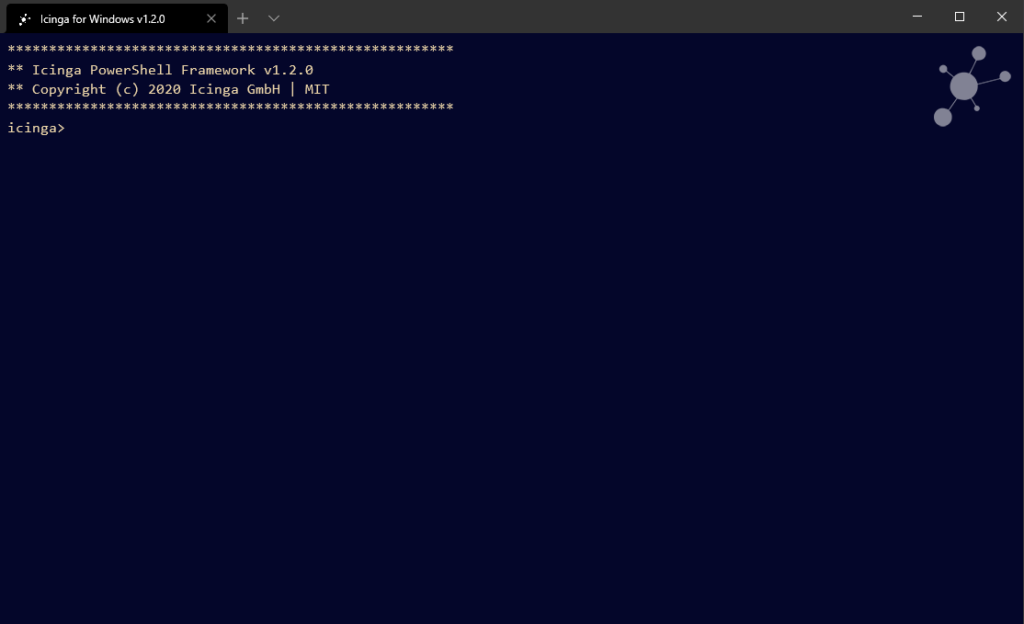
Icinga for Windows Terminal
During our internal development we quicky addressed one main issue: Developing by always creating a new PowerShell instance (to load changes) is very easy, but also a very inefficient by always typing:
powershell -C { Use-Icinga; <# Code to test #> }
To resolve this, we created a wrapper command which will take care of most of the above part and can easily be used to test commands:
icinga { <# code to test #> }
Based on this, we had the idea to create an own shell by using the new Windows Terminal and to integrate it there directly. This can partly be used by executing icinga inside a PowerShell, but not with the new cool theme! For the installation please read the Windows Terminal integration page.
MSSQL Plugins Preview
Last but not least we are proud to announce that as of today we officially support MSSQL basic monitoring with native PowerShell Plugins. Right now we are providing the following plugins:
- Invoke-IcingaCheckMSSQLBackup: Checks the current state of backups for the database, including backup age, backup size and database state
- Invoke-IcingaCheckMSSQLHealth: Checks if the database service is running and a connection is possible
- Invoke-IcingaCheckMSSQLPerfCounter: Allows you to check certain MSSQL Performance Counter, similar to Windows Performance Counter
- Invoke-IcingaCheckMSSQLResource: Provides a bunch of pre-configured Performance Counters which will be checked.
You can simply connect to the database by providing username and password or by using the integrated security. Last setting will use the user account the Icinga Agent/PowerShell instance is running with to authenticate against the database.
As this is a preview, we only provide the snapshot from the master branch. To test this, simply install them by using:
Install-IcingaFrameworkComponent -Name mssql -Snapshot;
Next Steps
For a full list of changes and modifications please have a look on the changelog which mentions every change we did so far. Last but not least we published an official roadmap for the Icinga for Windows solutions including topics we would like to cover next. Please feel free to upgrade your exisitng Icinga for Windows infrastructure or by testing it out. Please ensure you check out the upgrading docs for the Framework for this.
If you want to share your feedback or your future ideas please reach out to us! We enjoy reading your suggestions and ideas and are proud sharing them with everyone by adding them into our solution.