The fundamentals of Icinga 2 are check plugins. They are being executed and their return value is mapped to either Host or Service objects. Everything else follows on top. These check plugins can be...
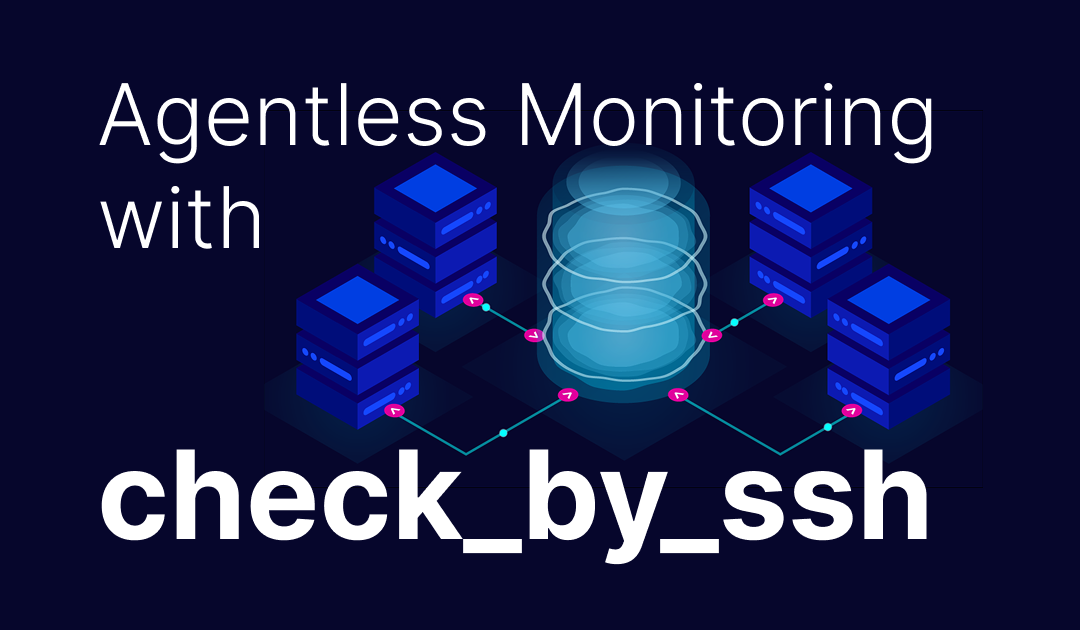
How to do Agentless Monitoring with check_by_ssh
The fundamentals of Icinga 2 are check plugins. They are being executed and their return value is mapped to either Host or Service objects. Everything else follows on top. These check plugins can be...
Releasing Icinga for Windows v1.13.0
Today we are happy to announce that we released Icinga for Windows v1.13.0 a couple of days ago. We have already talked about the changes coming to v1.13.0 with the beta blog-post last year in more depth, and will focus only on some core changes here. Improved...
Releasing Icinga 2 v2.14.5
Today, we are announcing the release of Icinga 2 v2.14.5. It fixes a regression that was introduced in v2.14.4 and caused the icinga2 node setup, icinga2 node wizard, and icinga2 pki request commands to fail if a certificate was requested from a node that has to...
Releasing Icinga for Windows v1.8.0 – The Power of Rework
Today we are happy to announce that after month of work we finally can release Icinga for Windows v1.8.0. As discussed in our live Icinga for Windows Q&A on our YouTube-Channel, we spent lots of time resolving issues reported by our community and customers and in...
Introduction to (Performance) Monitoring Metrics
To ensure the reliability and stability of your services, it's essential to understand the overall health of your infrastructure and systems. That variety of information from your systems helps you to get a proper context during your root cause investigation and react...

Why you need network monitoring?
Network monitoring is a continuous analysis of a network to detect and correct any performance issues. Network monitoring involves collecting network statistics to determine the quality of services offered by the network. With tools like Icinga, it's possible to...

Replay Log in Distributed Icinga Environments
An essential part of a distributed monitoring environment with Icinga that includes master, satellite and agent nodes is the replay log functionality. The replay log is a built-in mechanism to ensure nodes in a distributed setup keep the same history e.g. check...
Introducing Icinga Module for vSphere – Releasing version 1.2
One of the pillars of Icinga is integrations. With it's open APIs and various extensions, Icinga is capable of integrating seamlessly into your existing infrastructure. Today I want to give you an introduction to our VMware integration and share some details about the...
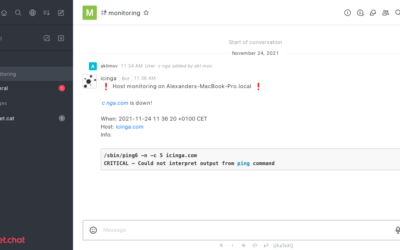
Icinga 2 Rocket.Chat notifications. The complete guide
About one year ago the NETWAYS colleagues showed you how to let Icinga 2 notify users through XMPP/Jabber. Now it's time to also cover the somewhat more fancy Rocket.Chat. No Rocket.Chat? No problem! Setting up a test system is pretty easy: Clone this Git repository...
Releasing Icinga DB v1.0-RC2 – Key Updates & Improvements
We are super excited to release the second Release Candidate of Icinga DB! This release comes after many hours, days and months of experimenting, re-thinking and rebuilding our own code and marks a huge step towards a new data backend for Icinga. Why Icinga DB Since...
Icinga DB Housekeeping
Introduction We all know that the history data is important in monitoring. But this history data becomes obsolete over time and those records become garbage which would only fill up space. So it is important to remove obsolete history records to free up space. We call...

Installing Additional Modules in the Icinga Web 2 Docker Container
The Docker images we provide for both Icinga 2 and Icinga Web 2 already contain quite a number of modules. For example, the Icinga Web 2 image contains all the Web modules developed by us. But one of the main benefits of Icinga is extensibility, so you might want to...

Subscribe to our Newsletter
A monthly digest of the latest Icinga news, releases, articles and community topics.