Introduction
In the dynamic realm of monitoring Kubernetes clusters, effective visualization is paramount for gaining insights into system health and performance. One versatile tool that has gained prominence in this domain is Scalable Vector Graphics (SVGs). In this blog post, we’ll delve into the usage of SVGs, explore different implementation methods, weigh the pros and cons, and discuss why they are indispensable for monitoring Kubernetes with Icinga2.
Understanding SVGs
Scalable Vector Graphics (SVGs) are XML-based vector image formats that enable the creation of highly scalable and resolution-independent graphics. Unlike raster images, SVGs are composed of mathematical descriptions of shapes, making them ideal for dynamic and responsive visualizations.
Different Ways to Use SVGs
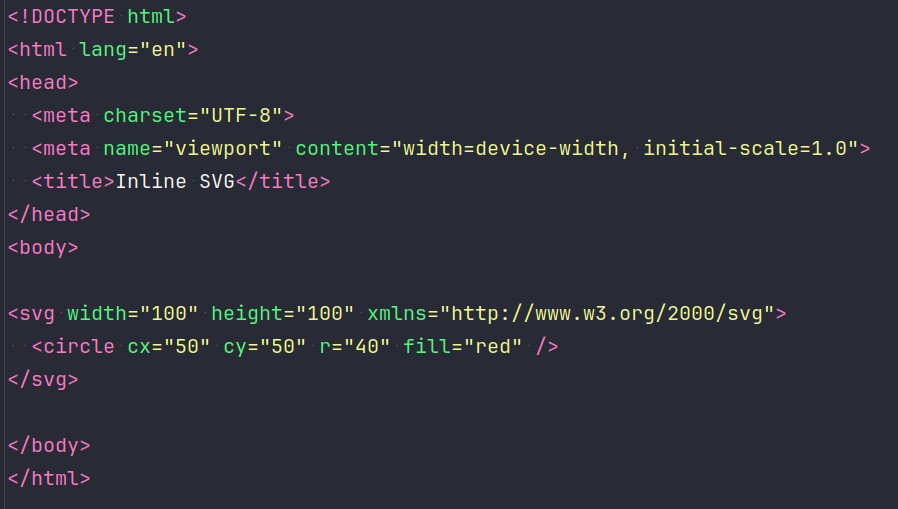
Inline SVGs:
Embedding SVG code directly within HTML or XML documents allows for seamless integration with web applications. This method offers flexibility and control over styling and interactivity.
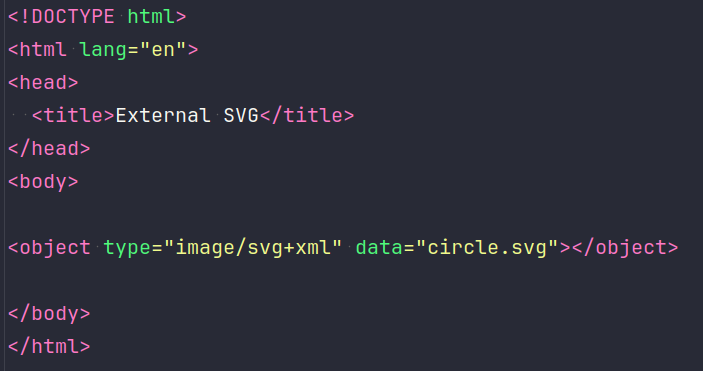
External SVG Files:
Storing SVG graphics in separate files enables reusability and modularity across multiple web pages or applications. External SVGs can be referenced using the <img> tag or through CSS background properties.
SVG sprites:
Consolidate multiple SVG icons or graphics into a single SVG sprite file to reduce HTTP requests and improve performance. Individual icons can then be accessed using <symbol> elements and referenced using <use> tags.
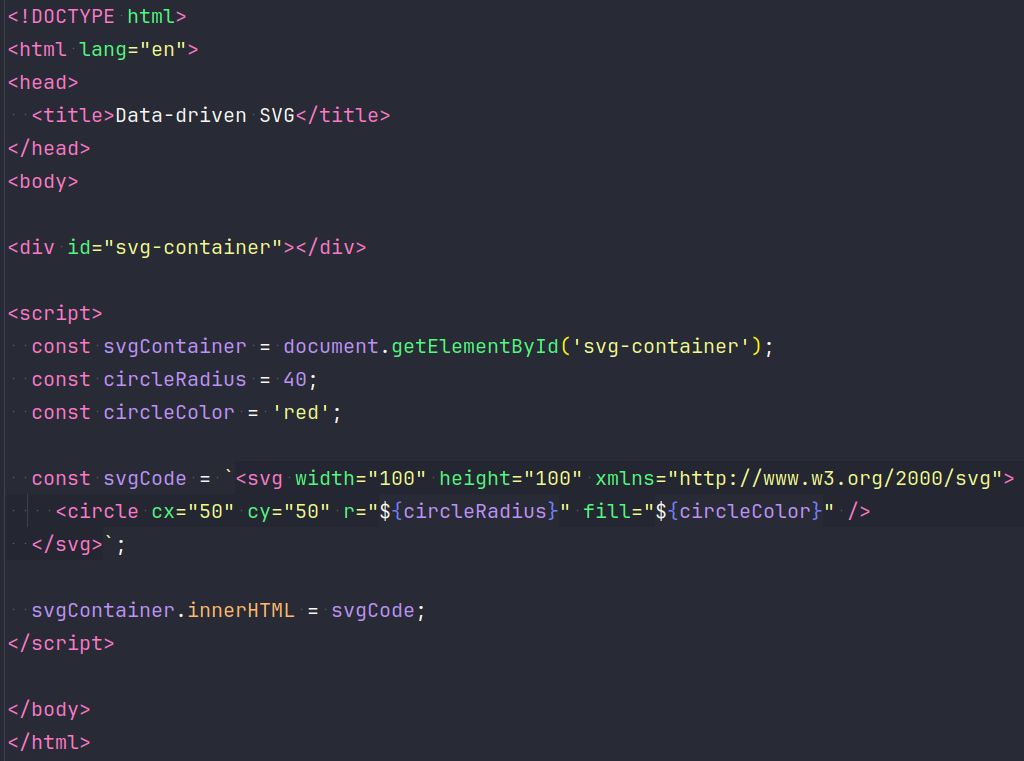
Data-driven SVGs:
Dynamic generation of SVG content based on real-time data enables interactive and customizable visualizations. Libraries such as D3.js make it easy to create data-driven SVG charts, graphs, and diagrams.
Same result for all ways:
In this example every way prints a red Circle with a radius of 40 and it’s center point has the coordinates x = 50 and y = 50
Pros and cons of SVGs
Pros:
- Scalability:
SVGs can be scaled infinitely without loss of quality, making them ideal for responsive design. - Interactivity:
SVGs support interactivity through JavaScript, CSS, and HTML events, enabling dynamic user experiences. - Accessibility:
SVGs can be styled and annotated with metadata to improve accessibility for users with disabilities. - SEO-friendly:
Search engines can index SVG content, improving discoverability and search engine optimization (SEO). - Animation:
SVGs support animations and transitions, allowing for engaging and interactive visual effects.
Cons:
- Complexity:
Complex SVG graphics can require a steep learning curve and complicated coding. - Browser Support:
While modern browsers offer extensive support for SVGs, older versions may have compatibility issues. - Performance overhead:
Rendering complex SVGs with intricate detail or animation can impact performance, especially on resource-constrained devices.
Who benefits from using SVG in Kubernetes monitoring?
DevOps engineers:
SVG-based visualizations provide insight into Kubernetes cluster health, resource utilization, and performance metrics.
System Administrators:
Interactive SVG dashboards facilitate real-time monitoring and troubleshooting of Kubernetes deployments.
Developers:
SVGs provide a versatile platform for creating custom monitoring tools, dashboards, and data visualizations tailored to specific needs.
Conclusion
In summary, SVGs are a versatile tool for creating dynamic visualizations and monitoring systems. Whether for projects like monitoring Kubernetes with Icinga2 or developing interactive web charts, SVGs offer scalability, interactivity, and accessibility. Their flexibility allows for seamless integration with other web technologies, ensuring broad compatibility and improving the user experience. With widespread browser support, SVGs are an ideal choice for building cross-platform monitoring solutions and data visualizations that reach a wide audience.

