We are happy to announce the release of Icinga Director version 1.11.6. This release addresses several important bug fixes and introduces improvements that enhance the overall stability of Icinga...

Icinga Director v1.11.6 Release
We are happy to announce the release of Icinga Director version 1.11.6. This release addresses several important bug fixes and introduces improvements that enhance the overall stability of Icinga...
Understanding Namespaces in Icinga 2 DSL
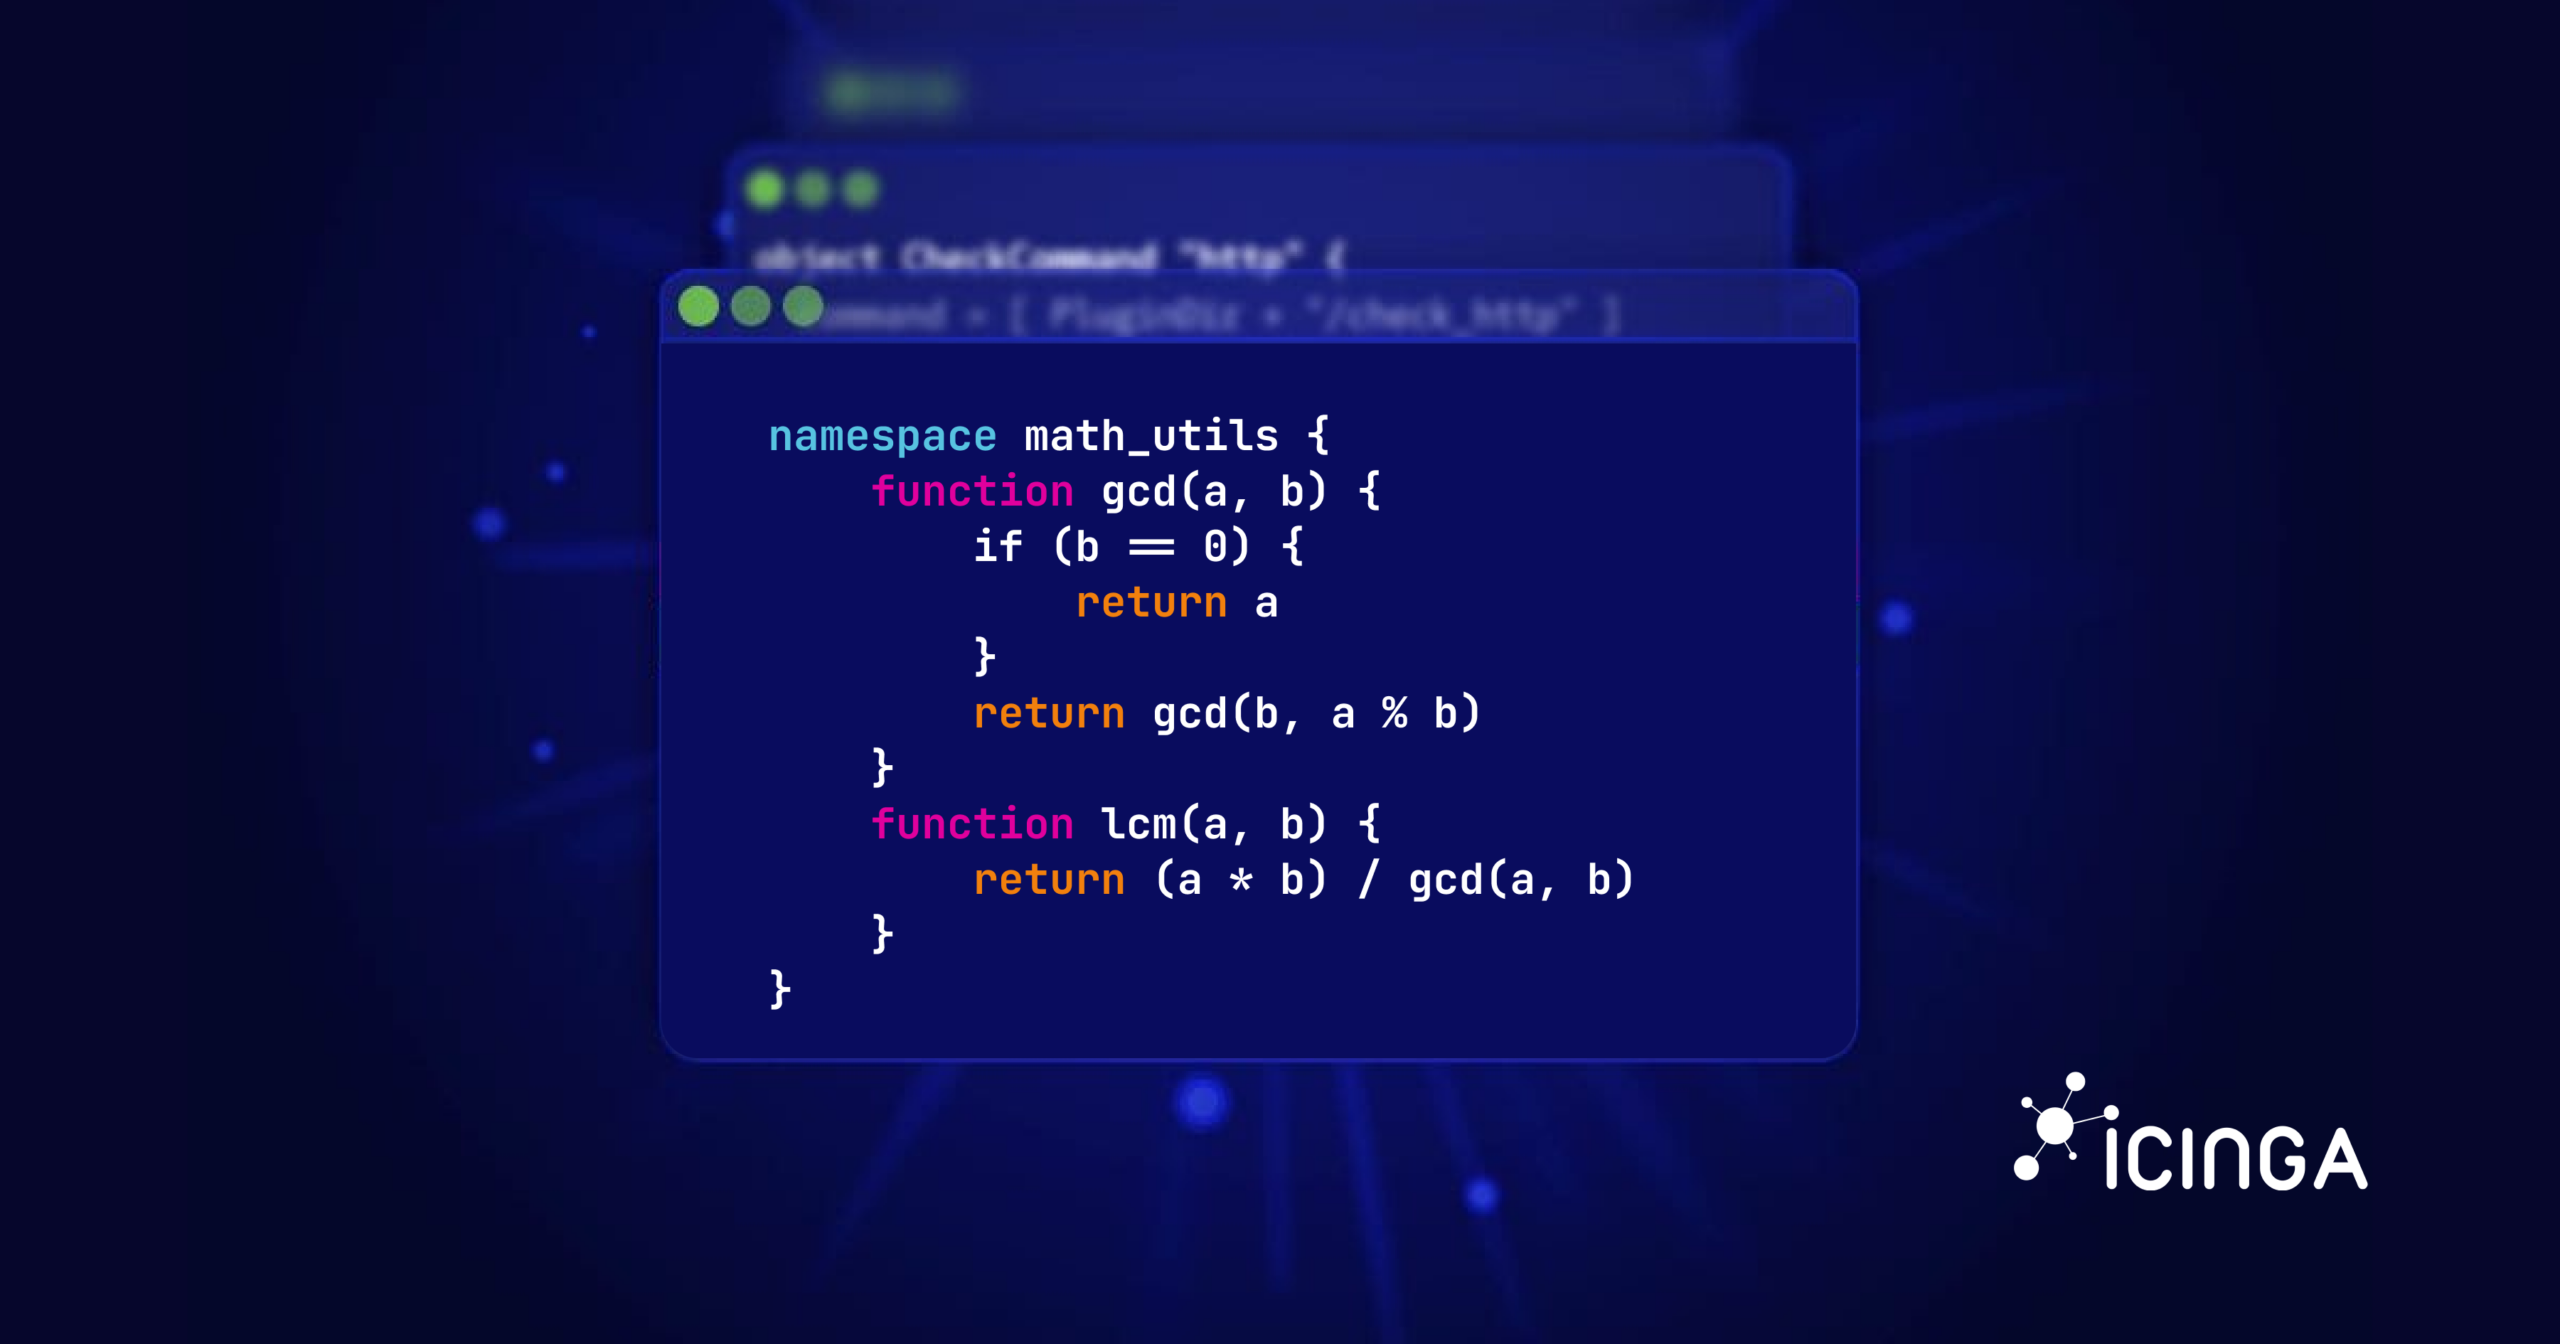
Last time, we explored the concept of variable scopes in Icinga 2, which help you manage and organize your DSL configurations effectively. As promised, today we'll dive into another, how shall I say, advanced topic: Namespaces in Icinga 2. What are Namespaces?...

How to Migrate an Icinga 2 Master in a High Availability Setup
Moving an Icinga 2 master to a new machine requires careful preparation, especially in a master-to-master high availability setup. In production environments, such migrations are often part of broader infrastructure changes, platform standardization, or long-term...
Releasing Icinga DB Web v1.2.2 and Icinga Web v2.12.5
Today we’re announcing the general availability of Icinga DB Web v1.2.2 and Icinga Web 2.12.5. Icinga DB Web This is a security release. It is recommended to upgrade quickly. You can find all issues related to this release on our roadmap. Access Granted The new...
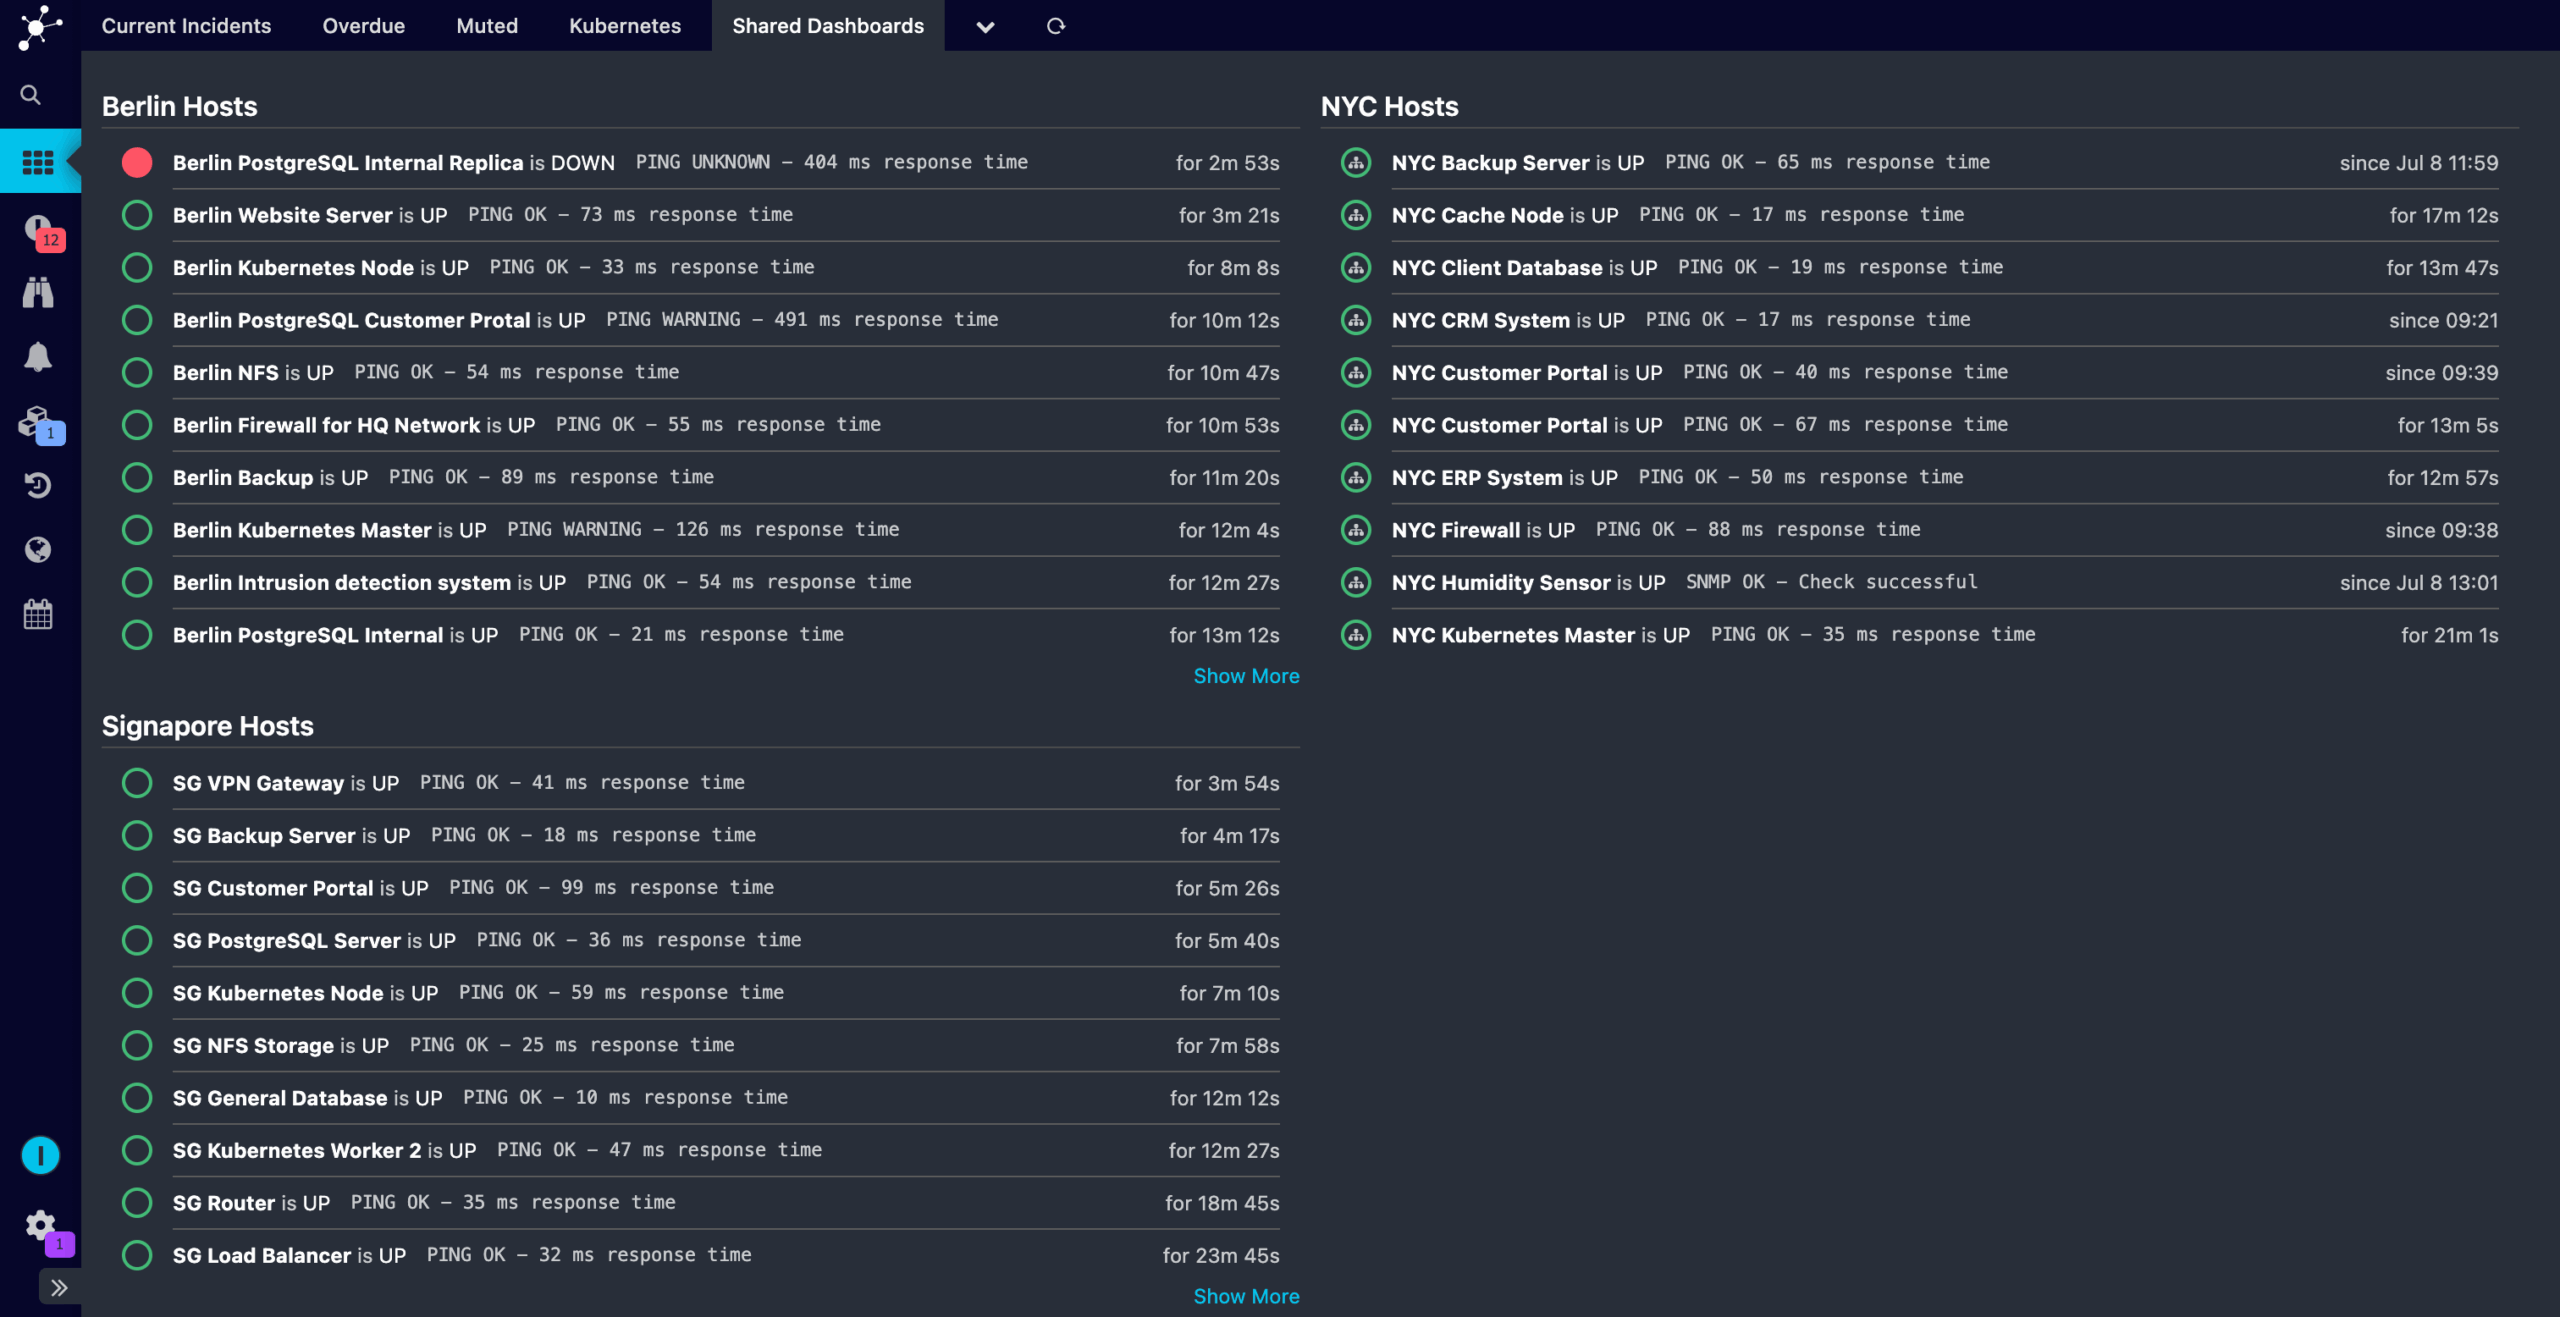
Dashboard Sharing – The Hard Way
Current Limitation: Dashboard Sharing Not Yet Supported Unlike menu items, dashboards in Icinga Web 2 currently can't be shared across users. This is something we will implement in future versions, but for now users can only create dashboards for themselves. We don't...
A little love for two old fellas – Icinga Business Process Modeling and Icinga Web Graphite Integration
Today is the day, we grant two products their long overdue maintenance. Maintenance always sounds boring, I hear you. But let me remind you that this also means we do and take care! And what this actually is all about: Icinga Business Process Modeling v2.5.2 Icinga...
We’re Still Flying the Rainbow Flag, Even When It’s Hard
It’s Pride Month: a time to celebrate the LGBTQIA+ community, reflect on the progress we’ve made, and acknowledge the challenges we still face. Around the world, queer people are once again being pushed to the margins - not just socially, but politically and...
A New Look At Dependencies: Icinga Dependency Views
We're excited to share that Icinga now offers an improved way to view dependencies. With the releases of Icinga DB Web 1.2.0, Icinga DB 1.4.0, and Icinga 2.15.0 today, any dependencies you've set up in Icinga will now be visually represented. Additionally, we're...
Beyond PHP-FPM: Modern PHP Application Servers
For decades, PHP has powered the web using a simple model: process a request, send a response, then shut down. This model, especially in the form of CGI and PHP-FPM, is easy to understand but increasingly inefficient for modern web demands. The Traditional Model: CGI...
IPL: How to create lists with ipl-web
In my previous blog post, I explained how to build lists using ipl-web widgets. That method will soon be deprecated due to its complexity. With the recent ipl-web release, we have introduced a simpler and more flexible approach to building lists, using a lightweight...
Icinga 2 DSL – Variable Scopes
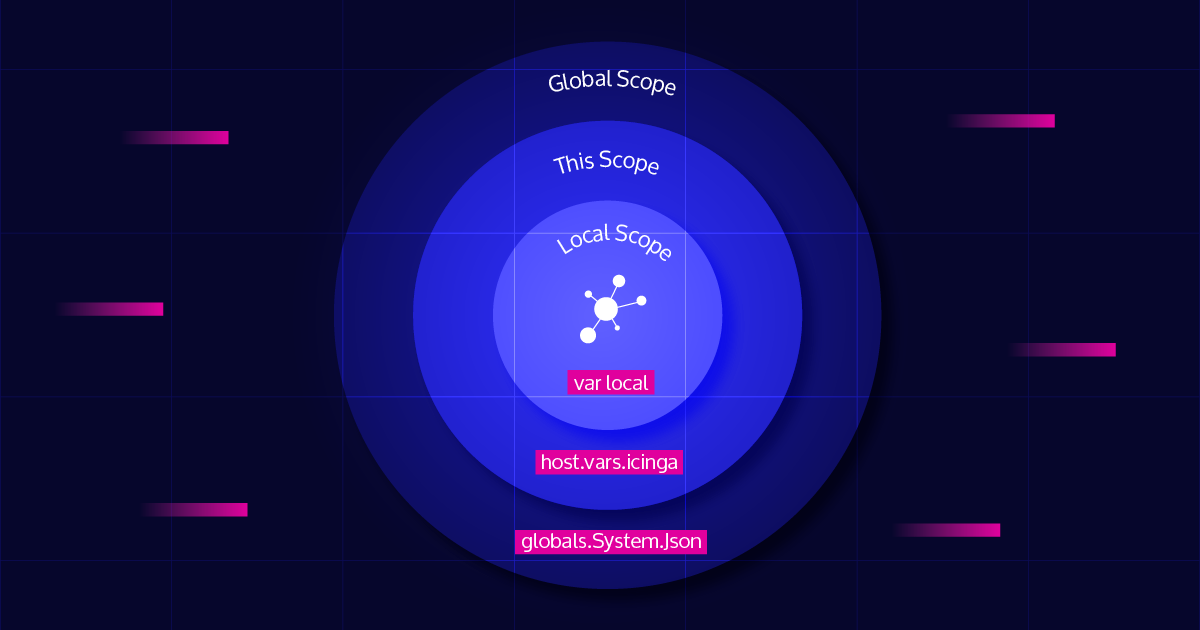
Ever wondered how Icinga 2 manages all those variables, and how it knows which one to use? In this blog post, we will explore all the different variable scopes in Icinga 2, and by the end, you will know what this mysterious error message means when you see it in your...
Hybrid IT Infrastructure Management
Introduction Today’s IT environments are rarely confined to a single data center or a single cloud provider. Enterprises are embracing a mix of cloud platforms, virtual machines, and on-premises hardware to stay agile and competitive. This blended environment is known...

Subscribe to our Newsletter
A monthly digest of the latest Icinga news, releases, articles and community topics.


