This is not just a version bump. Raising the PHP floor allowed us to modernize the IPL codebase in ways that were not possible before: strict type declarations throughout, and a cleaner, more...
Icinga Web v2.13 and IPL: PHP 8.5 Support & Module Updates Release
This is not just a version bump. Raising the PHP floor allowed us to modernize the IPL codebase in ways that were not possible before: strict type declarations throughout, and a cleaner, more...
Mirroring Icinga Packages in Air-Gapped and Restricted Environments
When hosting in a secure or corporate environment, Internet access is often restricted or blocked completely. While this makes sense from a security point of view, this introduces some challenges. For one, getting software packages. There are usually two approaches to...
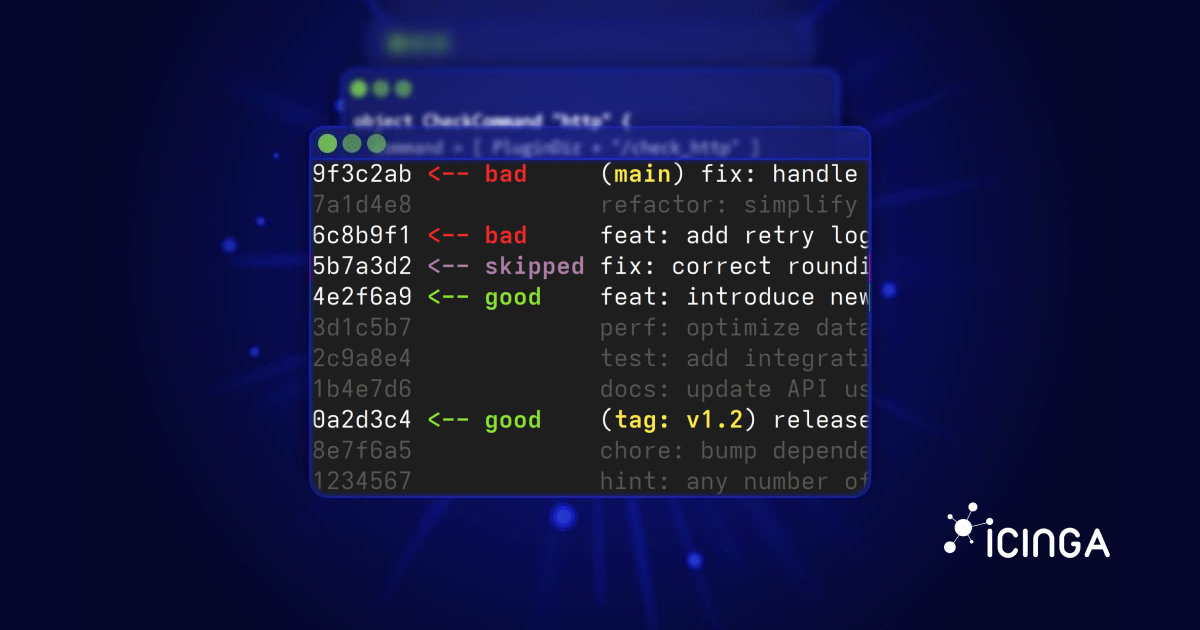
How to Use Git Bisect to Pinpoint Bugs Precisely
A feature that used to work suddenly broke. The problem? There were 300 commits since the last time I knew it worked. Checking each commit manually would take forever. Fortunately, Git has a tool designed exactly for this situation: git bisect. What is Git Bisect? The...

Simplified Database Schema Upgrades for Icinga Web and Modules
With the release of Icinga Web 2.12, we've streamlined and simplified the process for performing database schema upgrades for both Icinga Web and its modules. This new feature not only indicates when an upgrade is pending but also allows for automatic execution of the...
The Icinga Notifications Beta is Here!
This release has the version 0.1.0 and is available via our package repositories. Be sure to check the documentation on how to install it. So what is Icinga Notifications actually? It is not possible to explain every single detail now. We will eventually publish...

Organise a meetup with us!
Are you passionate about monitoring and keen to share your knowledge and experiences with others? Do you enjoy connecting with like-minded folks in the IT and DevOps world? Or do you just want some Icinga shirts for yourself? Well, we have some exciting news for you!...

Icinga for Windows without an Icinga 2 agent
I've already dropped a hint at this topic in a previous post of mine which reflected the history of Icinga on Windows: Icinga 2.14 will be able to directly speak to the PowerShell daemon REST API without even fork(2) or exec(3) for a subprocess (...). In fact this...

Effective Monitoring Strategy: 10 Tips for Success
As a software developer in training at Icinga, I've learned a lot about the nuances and importance of monitoring systems. Effective monitoring is critical for maintaining the health, performance and security of any infrastructure or application. Here are ten essential...

New Redis® open source server packages for Icinga DB
Finally, we are pleased to announce the availability of the new Redis®* open source server packages for Icinga DB for all supported distributions 🎉. You may have already noticed that we had some issues with the previous packages here and there, but we've been working...
Icinga and NetBox Labs Partner to Automate Network Monitoring
One of the major strengths of Icinga is its capability to integrate with many other tools to automate and scale IT infrastructure monitoring. Today, we're happy to announce the certification of an integration between Icinga and NetBox. The solution was developed over...

Thank You for an Amazing Icinga Summit 2024 in Berlin!
What an amazing two days we’ve had! The Icinga Summit 2024 in the heart of Berlin was a great success, and we are deeply thankful to everyone who contributed to making it happen. From the moment the doors opened, the atmosphere was vibrant. The Kulturbrauerei Palais,...
Native Binaries with PHP
There is always a big debate about whether interpreted or compiled languages are more useful. I think it is important to look at the pros and cons. Both language types have their strengths and weaknesses. While interpreted languages are great for maintaining and...

Subscribe to our Newsletter
A monthly digest of the latest Icinga news, releases, articles and community topics.
