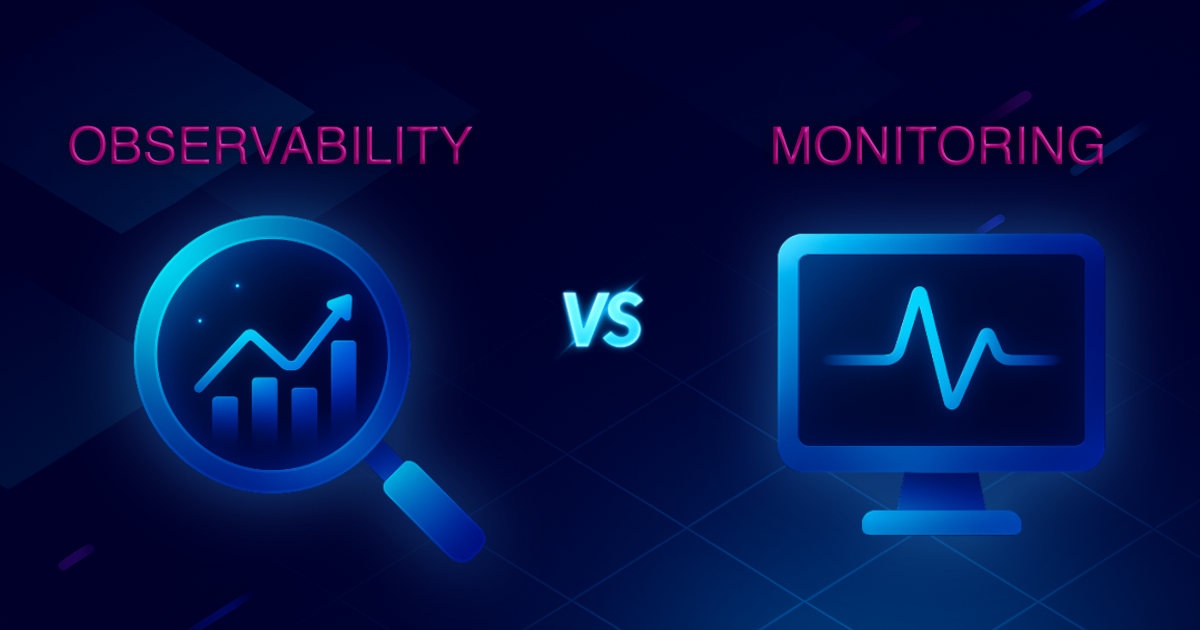
In the dynamic world of IT operations, a common misconception has emerged: Observability vs Monitoring is often framed as a battle where one replaces the other. At Icinga, where open-source monitoring is our expertise, we aim to clarify this misunderstanding. Observability doesn’t supplant monitoring, it complements and enhances it.
The term “Observability” has become a buzzword in the tech industry, often touted as the modern solution to outdated, static monitoring practices. However, as highlighted in our previous blog post, Understanding Observability, Monitoring, and Telemetry Differences, it’s crucial to understand that observability and monitoring serve distinct yet complementary roles in IT infrastructure management.
Revisiting the Basics: Observability vs Monitoring
In our earlier discussion, we explored the foundational concepts:
-
Monitoring: Collects and analyzes performance data to gauge system health, offering real-time feedback and enabling quick responses to anomalies.
-
Observability: Provides a broader perspective, capturing nuances that might go unnoticed with traditional monitoring, and helps identify potential issues before they escalate.
-
Telemetry: Involves the automated transmission of data from remote systems, feeding valuable information into monitoring and observability frameworks.
Building upon that foundation, let’s delve deeper into the distinctions highlighted in Observability vs. Monitoring, exploring how each plays a unique role in IT system management.
Monitoring: The First Line of Defense
Monitoring focuses on tracking known issues. It involves setting thresholds, defining alerts, and proactively addressing potential problems. With Icinga, this includes uptime checks, service health assessments, CPU usage, disk space, and network traffic monitoring. Monitoring alerts you when your database is down or when your web server’s latency spikes.
Key aspects of monitoring:
-
Threshold-based alerts
-
Real-time notifications
-
Proactive issue detection
-
Immediate incident response
However, when issues arise without triggering alerts, and all monitored metrics appear normal, monitoring alone may not suffice.
Observability: Uncovering the Unknowns
Observability enables a system to explain its internal state. Instead of merely alerting when CPU usage hits 95%, observability seeks to understand why the CPU is spiking. What service call caused it? What downstream systems were affected?
It delves into the unknown unknowns, utilizing traces, metrics, and logs to reconstruct the full story behind performance issues or outages.

Key aspects of observability:
-
Contextual and investigative approach
-
Utilization of logs, traces, and high-cardinality metrics
-
Ideal for complex, distributed systems
-
Facilitates deep root cause analysis
While monitoring indicates that something is wrong, observability helps you understand the underlying reasons.
The Synergy: Observability and Monitoring Together
It’s essential to recognize that observability doesn’t function in isolation. Monitoring provides the foundational data streams necessary for observability. Without monitoring, observability would lack the input it needs to analyze system behavior.
At Icinga, we often say: Monitoring is the heartbeat; observability is the diagnosis.
You still need to:
-
Know if your service is down (monitoring)
-
Understand why it went down (observability)
-
Collect that data in the first place (telemetry)
Both are vital. One doesn’t replace the other—they work hand in hand.
Practical Implications for IT Teams
In modern environments, think microservices, containers, cloud-native stacks, complexity is the norm. Monitoring can catch the symptoms. Observability helps decode the disease.
Eliminating traditional monitoring entirely would result in the loss of speed and clarity. Imagine trying to diagnose a failing service without knowing if it’s even up – not helpful at all.
A balanced approach involves:
-
Using Icinga to monitor service health, uptime, and availability.
-
Enriching your stack with observability data: logs, traces, and metrics from applications and services.
-
Correlating alerts with context for faster, smarter incident response.
This strategy underscores the importance of understanding Observability vs. Monitoring, ensuring that IT teams are equipped to both detect issues promptly and diagnose their root causes effectively.
TL;DR: Observability Enhances Monitoring
| Feature | Monitoring | Observability | ||
|---|---|---|---|---|
|
Focus |
|
Known issues |
|
Unknown issues |
|
Method |
|
Thresholds & alerts |
|
Context & correlation |
|
Tools |
|
Icinga, Nagios, Prometheus |
|
OpenTelemetry, Jaeger, Grafana |
|
Use Case |
|
System health, uptime |
|
Root cause analysis |
|
Relation |
|
Foundational |
|
Complementary |
Icinga’s Role in the Observability Landscape
At Icinga, we’ve always believed in the power of robust, customizable monitoring. But we also embrace the evolution of observability.
Our integrations with tools like Elasticsearch, Prometheus, and Grafana bring observability into your monitoring workflows—not as a competitor, but as a collaborator.
Want to combine metrics with logs? Visualize trace data alongside your service checks? Icinga’s modular architecture lets you build the stack that works for you. No vendor lock-in, no bloated dashboards, just pure open-source power.
Conclusion: Embracing Both for IT Excellence
In a world of increasing system complexity, IT teams need both real-time alerts and deep diagnostic tools. Monitoring provides control. Observability offers clarity.
Together, they ensure resilience.
So, the next time someone says, “Observability is the future, monitoring is dead,” just smile and tell them:
“Observability is the future – with monitoring at its core.”
Ready to Explore Observability vs Monitoring in Action?
Curious how Icinga can bring observability and monitoring together in your infrastructure?
Get started with Icinga and see it in action.
Have questions, ideas, or want to connect with fellow sysadmins?
Join the Icinga Community and be part of the conversation.

