Icinga is designed to be a highly dynamic monitoring software that can monitor your setup, regardless of its architecture. While most setups are hierarchical and fit well into the master,...
Monitor One Icinga 2 Cluster From Another
Icinga is designed to be a highly dynamic monitoring software that can monitor your setup, regardless of its architecture. While most setups are hierarchical and fit well into the master,...

Drowning in Alert Fatigue? How to Regain Control of Your Monitoring
Introduction: Why Alert Fatigue Hits Sysadmins Sooner or Later If you’ve ever muted your phone during a maintenance window, only to miss a real outage an hour later, you’re not alone. Sysadmins on Reddit and beyond often describe feeling like they’re drowning in...

Using Icinga 2 on NixOS
I use NixOS by the way. And today I'm going to show you how to operate a simple Icinga setup using that operating system. I.e. a single node with checks and notifications. In contrast to Icinga Web 2 or Redis, NixOS provides an Icinga 2 package, but no module....

Investment Trends in Infrastructure Monitoring Market: What Users Should Know
In recent months, the IT monitoring landscape has seen notable investment activity: Turn/River Capital acquired SolarWinds. The same firm previously invested in Paessler (PRTG). Checkmk announced a strategic investment from PSG. These developments are part of a larger...

How To Pick The Correct Metrics For Your Monitoring
This is a guest blogpost by Adam Sweet from the Icinga Partner Transitiv Technologies. Since this is a longer post, we added a tl;dr at the end. For many, host and application monitoring is an afterthought at the end of a project. Some people don’t think about...

Monitor Microservices Effectively: A Practical Guide
Contents What Is Microservice Monitoring? Why Monitoring Microservices Is Different – and What It Means for You Key Metrics and Signals You Should Track Best Practices for Monitoring Microservices Monitoring Tools for Microservices: What to Look For Microservice...
Icinga 2 Insights With Event Streams
There are many ways to interact with the data that Icinga 2 collects, processes, and produces. The most common is probably Icinga Web, which displays checks in all the colors of a traffic light. Icinga 2 also comes with several metrics or performance data writers. But...
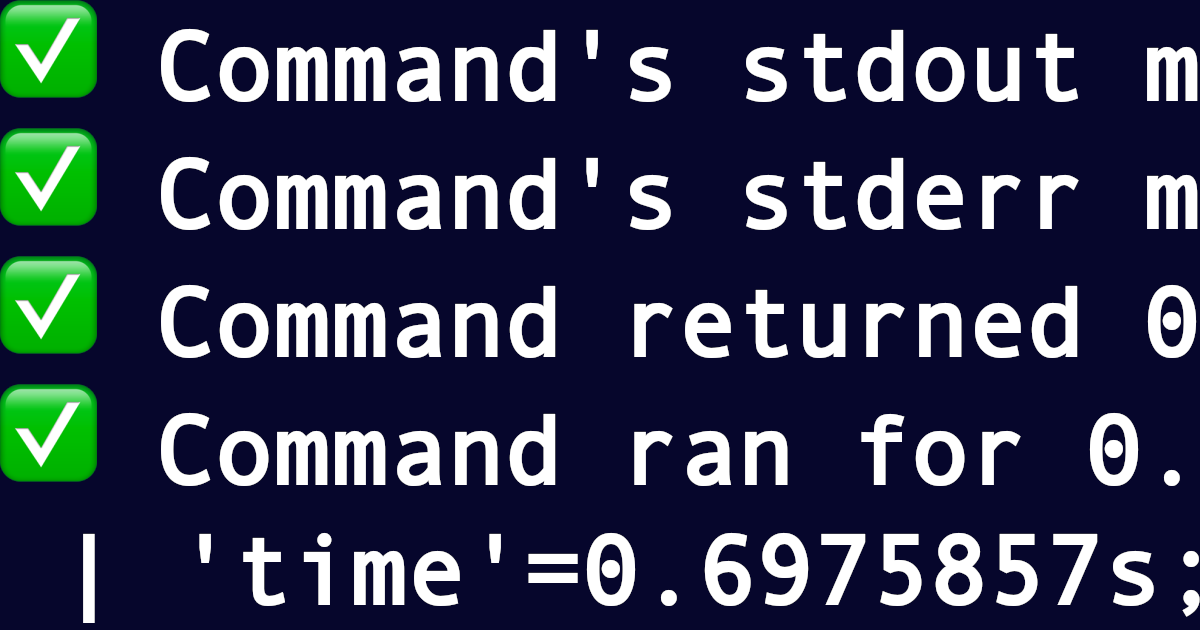
Turns any command into a plugin: check_rungrep
Imagine you have one more special thing to monitor. While our Icinga 2 can observe infrastructure of almost any size, it still needs a plugin for each kind of check. Unfortunately not every command meets the monitoring plugin API: exit code 0-3 (ok, warning, critical,...
How to do Agentless Monitoring with check_by_ssh
The fundamentals of Icinga 2 are check plugins. They are being executed and their return value is mapped to either Host or Service objects. Everything else follows on top. These check plugins can be either from the Monitoring Plugins or custom. While their origin does...

Common cloud monitoring challenges we can overcome!
In today's fast-paced digital landscape, businesses are moving their operations to the cloud more than ever before. This shift brings incredible benefits like scalability, flexibility, and cost-efficiency. While it does introduce various common cloud monitoring...
Monitoring the Monitoring: Demystifying the Icinga DB Health Check
In this post we will take a look at the icingadb check command built into Icinga 2 for monitoring the health of Icinga DB. If you have already configured it, this blog post will give you some insights on what it actually checks, otherwise, it showcases what useful...

Icinga Notifications – How to Set Up Desktop Alerts
We recently released the beta version of our Notification Web Module, which includes a cool feature that is not yet known to everyone. We named it Desktop Notifications (Browser Push Notifications). With this feature enabled, your browser can send you instant...

Subscribe to our Newsletter
A monthly digest of the latest Icinga news, releases, articles and community topics.
