Icinga is designed to be a highly dynamic monitoring software that can monitor your setup, regardless of its architecture. While most setups are hierarchical and fit well into the master, satellites, and agents scheme with different zones, it is sometimes impractical or impossible to create one large Icinga 2 cluster.
Imagine that you are responsible for only some hosts within another organization. You and the other organization have independent Icinga 2 setups, and you cannot access these hosts from your Icinga 2 setup. Connecting to the other Icinga 2 cluster allows you to obtain the necessary information if something goes wrong, and to log in to the other Icinga Web 2 or directly SSH into the machine to investigate.
Icinga 2 REST API
The key to gaining insight into Icinga 2 is its REST API. It comes with a granular permission model that allows you to specify what each ApiUser can see.
In addition to good old username and password authentication, you can also authenticate with client certificates. When storing login information in another Icinga 2 installation, choosing client certificates eliminates the need for credentials in custom variables. Storing the certificates as files that are only readable by your Icinga 2 system user automatically lets the OS take care of permissions.
Status Overview
The /v1/status API endpoints provide a good first look at an Icinga 2 setup. One useful endpoint is the Common Information Base (CIB) class, which provides counters of host and service states.
To allow an ApiUser to access this information, the status/query permission is required.
object ApiUser "cib-watcher" {
  client_cn = "cib-watcher"
  permissions = [ "status/query" ]
}
$ curl -s -f -S \
  --cacert icinga-ca.crt --cert user.crt --key user.key \
    https://localhost:5665/v1/status/CIB \
  | jq -r '.results[].status'
{
  "active_host_checks": 2.716666666666667,
  "active_host_checks_15min": 3163,
  "active_host_checks_1min": 163,
  "active_host_checks_5min": 1054,
  "active_service_checks": 65.88333333333334,
  "active_service_checks_15min": 59462,
  "active_service_checks_1min": 3953,
  "active_service_checks_5min": 19805,
  "avg_execution_time": 2.048907945657096,
  "avg_latency": 0.00032090015572454583,
  "current_concurrent_checks": 116,
  "current_pending_callbacks": 0,
  "max_execution_time": 4.141482830047607,
  "max_latency": 0.00436711311340332,
  "min_execution_time": 0,
  "min_latency": 0.0001010894775390625,
  "num_hosts_acknowledged": 0,
  "num_hosts_down": 44,
  "num_hosts_flapping": 0,
  "num_hosts_handled": 0,
  "num_hosts_in_downtime": 0,
  "num_hosts_pending": 0,
  "num_hosts_problem": 44,
  "num_hosts_unreachable": 0,
  "num_hosts_up": 965,
  "num_services_acknowledged": 0,
  "num_services_critical": 42,
  "num_services_flapping": 7,
  "num_services_handled": 168,
  "num_services_in_downtime": 0,
  "num_services_ok": 3981,
  "num_services_pending": 0,
  "num_services_problem": 45,
  "num_services_unknown": 1,
  "num_services_unreachable": 160,
  "num_services_warning": 2,
  "passive_host_checks": 0,
  "passive_host_checks_15min": 0,
  "passive_host_checks_1min": 0,
  "passive_host_checks_5min": 0,
  "passive_service_checks": 0,
  "passive_service_checks_15min": 0,
  "passive_service_checks_1min": 0,
  "passive_service_checks_5min": 0,
  "remote_check_queue": 0,
  "uptime": 11845.085864067078
}
Thanks for infodumping, Icinga 2.
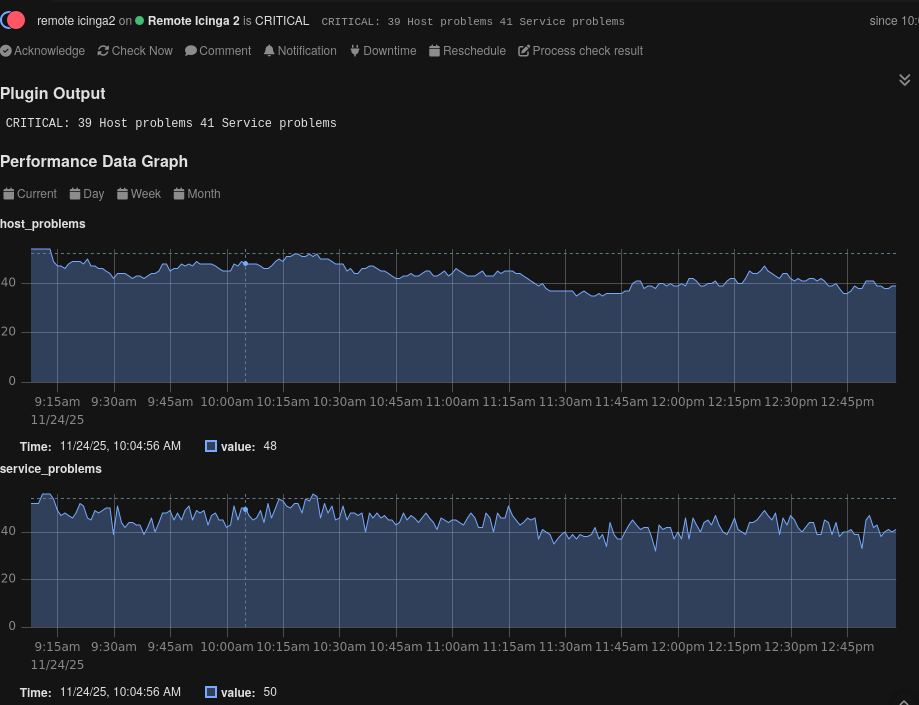
However, for a first status overview, both num_hosts_problem and num_services_problem might be useful, indicating if some hosts or services are in a problem state. The following is an example of how this API request can be integrated into a short check plugin.
#!/bin/sh

set -eu
set -o pipefail

if [ "$#" -lt 2 ]; then
  echo "Usage: $0 api curl-opts..."
  exit 3
fi

API=$1; shift

curl -s -f -S \
  -H 'Accept: application/json' \
  "$@" \
  "${API}/v1/status/CIB" \
  | jq -r '.results[].status | [.num_hosts_problem, .num_services_problem] | @tsv' \
  | awk -F '\t' \
    '{
       out = ""
       if ($1 > 0) { out = " " $1 " Host problems" }
       if ($2 > 0) { out = out " " $2 " Service problems" }

       out = out "|host_problems=" $1 " service_problems=" $2

       if ($1 > 0 || $2 > 0) {
         print "CRITICAL:" out
         exit 2
       }
       print "OK: Everything is green" out
     }'
This script uses the CIB API endpoint that was just shown, extracts the two problem counter fields, and produces the expected output of a check plugin. Arguments for curl(1) are passed through, which allows both client certificates and passwords to be used and even enables the skipping of certificate validation – but only in testing instances, right?!
$ ./check_icinga2_cib.sh https://example.com:5665 --cacert icinga-ca.crt --cert user.crt --key user.key
OK: Everything is green|host_problems=0 service_problems=0
$ echo $?
0

$ ./check_icinga2_cib.sh https://localhost:5665 --insecure --user root:icinga
CRITICAL: 40 Host problems 41 Service problems|host_problems=40 service_problems=41
$ echo $?
2
In Icinga 2, the check can be integrated using a CheckCommand.
object CheckCommand "icinga2_cib" {
  command = [ PluginDir + "/check_icinga2_cib" ]

  arguments = {
    "(api)" = {
      value    = "$icinga2_cib_api$"
      skip_key = true
      order    = -1
    }

    "--cacert" = "$icinga2_cib_cacert$"
    "--cert"   = "$icinga2_cib_cert$"
    "--key"    = "$icinga2_cib_key$"

    "--insecure" = { set_if = "$icinga2_cib_yolo_tls$" }
    "--user"     = "$icinga2_cib_auth$"
  }
}
Host Overview
The opening example was about monitoring specific hosts within another Icinga 2 cluster. In this scenario, we want to know if anything is wrong with the hosts.
We can fetch all services on a host by querying the /v1/objects/services API endpoint with a filter. It is possible to configure the filter to retrieve only services in a problem state, meaning no filtering is required in the check command itself.
$ curl -s -f -S \
  --cacert icinga-ca.crt --cert user.crt --key user.key \
  -H 'Accept: application/json' \
  -H 'X-HTTP-Method-Override: GET' -X POST \
  -d '{ "filter": "service.host_name == host_name && service.state > 0 && service.state_type == 1 && !service.handled", "filter_vars": {"host_name": "docker-master"} }' \
  'https://localhost:5665/v1/objects/services' \
  | jq '.results[] | .attrs.name'
"ssh"
"http"
"disk /"
"procs"
This example has a fairly complex filter expression. In a nutshell, it returns all services
- on the host identified by the
host_namevariable – set to docker-master viafilter_vars– - having a service state greater than zero – 0 is OK, 1 is WARNING, 2 is CRITICAL, and 3 is UNKNOWN –
- where the state type is 1 – 0 is SOFT and 1 is HARD –
- which are not handled – neither in a downtime nor acknowledged.
But wait, to proceed, we need a new ApiUser or at least new privileges. As mentioned, Icinga 2 has a fine granular permission system. It is possible to only expose certain services to an ApiUser.
For illustrative purposes, only allow access to the services of a host that has our ApiUser listed in its maintainers custom variable array.
object ApiUser "service-connoisseur" {
  client_cn = "service-connoisseur"
  permissions = [
    {
      permission = "objects/query/Service"
      filter = {{ "service-connoisseur" in host.vars.maintainers }}
    },
  ]
}
Thus, the docker-master host might look as follows.
object Host "docker-master" {
  import "generic-host"
  address6 = "2001:db8:23::42"

  vars.maintainers = [ "service-connoisseur" ]
}
Now, let’s get back to topic and embed the curl(1) command into a check command similar to the one used for the CIB example above.
#!/bin/sh

set -eu
set -o pipefail

if [ "$#" -lt 3 ]; then
  echo "Usage: $0 api host curl-opts..."
  exit 3
fi

API=$1; shift
HOST=$1; shift

curl -s -f -S \
  -H 'Accept: application/json' \
  -H 'X-HTTP-Method-Override: GET' \
  -X POST \
  -d '{
        "filter": "service.host_name == host_name && service.state > 0 && service.state_type == 1 && !service.handled",
        "filter_vars": {"host_name": "'"$HOST"'"}
      }' \
  "$@" \
  "${API}/v1/objects/services" \
  | jq -r '.results[] | [.attrs.name, .attrs.state] | @tsv' \
  | awk -F '\t' \
    'BEGIN {
       services = ""; state = 0;
       states[1] = states[2] = states[3] = 0
       split("OK,WARNING,CRITICAL,UNKNOWN", stateName, ",")
     }
     {
       services = services " (" stateName[$2+1] ") " $1
       state = ($2 > state) ? $2 : state
       states[$2]++
     }
     END {
       ORS = ""
       print stateName[state+1] ": " ((state == 0) ? "Services operational" : "Faulty services:" services) "|"
       for (s in states) {
         print "services_" tolower(stateName[s+1]) "=" states[s] " "
       }
       print "\n"

       exit state
     }'
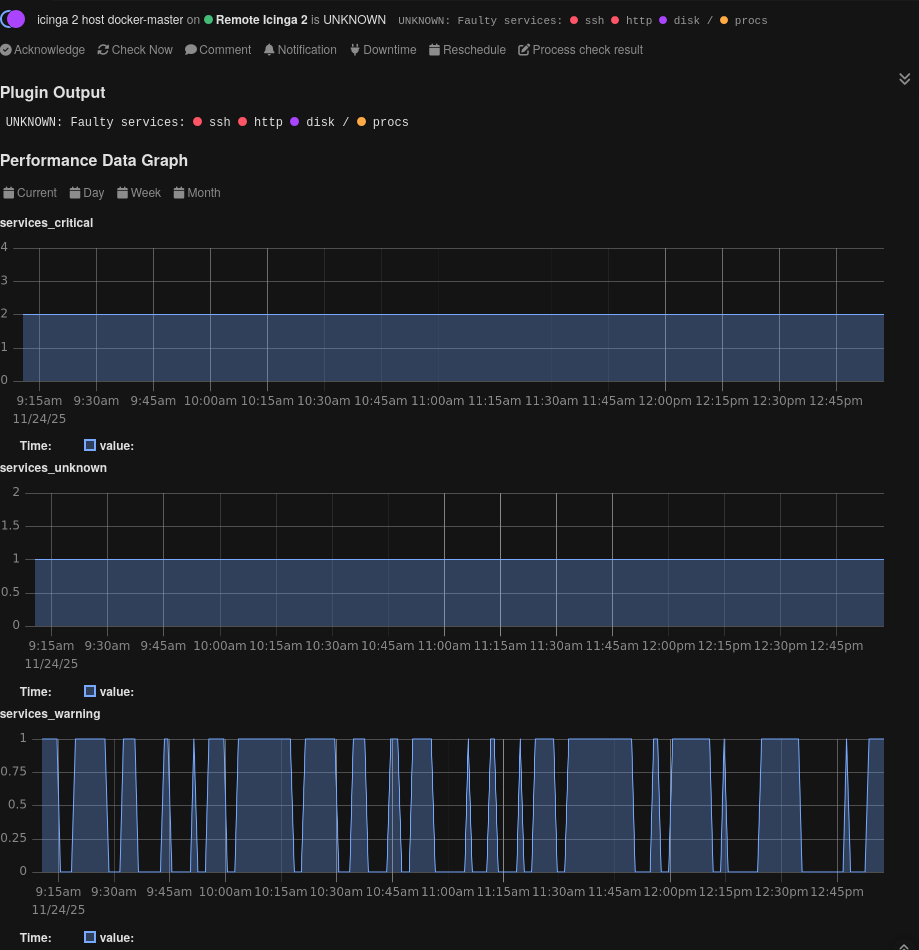
It has quite some similarities to the previous script, but returns the maximum state of all problematic services.
$ ./check_icinga2_cib.sh https://example.com:5665 dummy-23 --cacert icinga-ca.crt --cert user.crt --key user.key
OK: Services operational|services_warning=0 services_critical=0 services_unknown=0
$ echo $?
0

$ ./check_icinga2_host.sh https://localhost:5665 docker-master --insecure --user root:icinga
UNKNOWN: Faulty services: (CRITICAL) ssh (CRITICAL) http (UNKNOWN) disk / (WARNING) procs|services_warning=1 services_critical=2 services_unknown=1
$ echo $?
3
And again, let’s create a CheckCommand.
object CheckCommand "icinga2_host" {
  command = [ PluginDir + "/check_icinga2_host" ]

  arguments = {
    "(api)" = {
      value    = "$icinga2_host_api$"
      skip_key = true
      order    = -2
    }
    "(hostname)" = {
      value    = "$icinga2_host_hostname$"
      skip_key = true
      order    = -1
    }

    "--cacert" = "$icinga2_host_cacert$"
    "--cert"   = "$icinga2_host_cert$"
    "--key"    = "$icinga2_host_key$"

    "--insecure" = { set_if = "$icinga2_host_yolo_tls$" }
    "--user"     = "$icinga2_host_auth$"
  }
}
Let’s wrap things up!
These were just two (hopefully!) motivational examples of how to use the Icinga 2 REST API to get insights from another Icinga cluster. The API offers lots of possibilities, some already explored in prior blog posts, others waiting to be described or put into a new context.