Contents
- What Is Microservice Monitoring?
- Why Monitoring Microservices Is Different – and What It Means for You
- Key Metrics and Signals You Should Track
- Best Practices for Monitoring Microservices
- Monitoring Tools for Microservices: What to Look For
- Microservice Monitoring in Practice: A Step-by-Step Workflow
- FAQs: Monitoring Microservices
Modern applications are often built using microservices: Small, independent components that work together. This makes systems more flexible and scalable, but also harder to monitor.
In this guide, we’ll explain what microservice monitoring is, why it’s different from traditional approaches, and how to do it effectively. Whether you’re starting from scratch or improving an existing setup, this article will help you monitor microservices with confidence.
What Is Microservice Monitoring?
Microservice monitoring means tracking the health and performance of multiple, distributed services. Each service may run in its own container, on a different host, or as part of a Kubernetes deployment and be managed by a separate team.
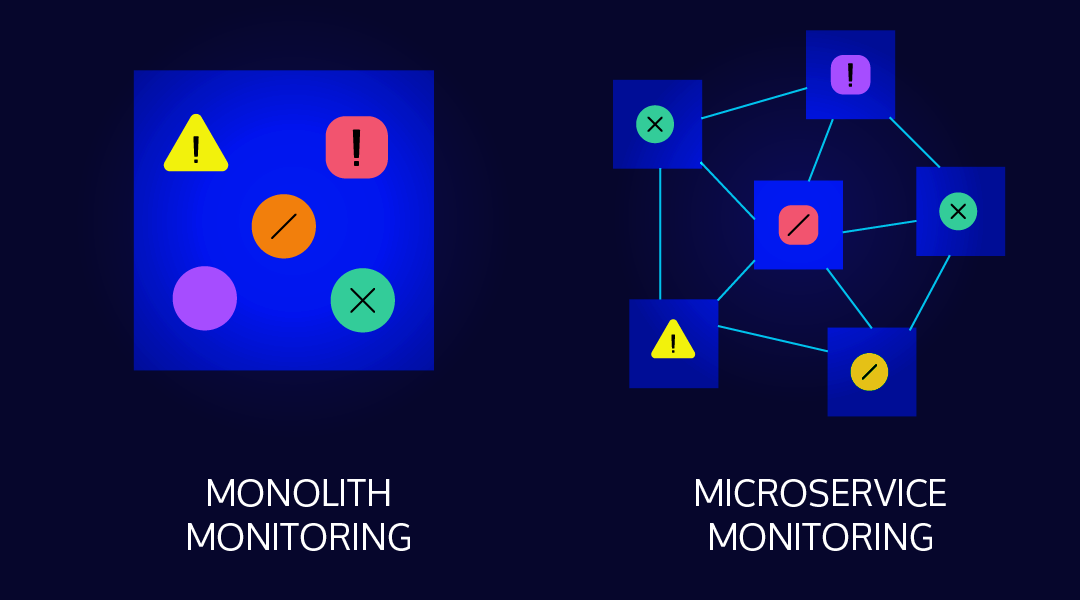
Microservice monitoring means tracking the health and performance of multiple, distributed services. Each service may run in its own container, on a different host, or as part of a Kubernetes deployment and be managed by a separate team.
This distributed setup introduces new challenges. You’re no longer monitoring a single app on a single server. Instead, you need to understand:
-
Is each service available and healthy?
-
How do they behave under load?
-
How does one failure affect others?
To answer these questions, you need ideally a combination of metrics, logs, and traces all in one place. Monitoring microservices is as much about understanding service interactions as it is about watching resource usage.
Traditional tools like Icinga still play a central role, especially for infrastructure, hosts, and basic service checks. But to monitor microservices effectively, we must go a step further and understand service-level behaviors and relationships.
Running your microservices on Kubernetes? Discover how Icinga helps you monitor Kubernetes in hybrid environments.
Why Monitoring Microservices Is Different – and What It Means for You
In traditional systems, you typically monitor a few servers and a centralized application. These systems are static, predictable, and easier to visualize. Microservices shift this dynamic.
In a microservice architecture:
- Services are deployed independently
- Infrastructure is dynamic
- Failures are harder to trace and often affect multiple components
This makes it harder to detect the root cause of issues. Monitoring must adapt. For example, a slow API response could be due to latency in another downstream service, a misconfigured queue, or container resource exhaustion.
At the same time, traditional monitoring doesn’t become irrelevant. Tools like Icinga are still essential for checking host availability, system health, and uptime across environments. What changes is the scope and depth of what we monitor.
Microservices don’t just need more data—they need better correlation across systems.
That’s the real shift.
Key Metrics and Signals You Should Track
In a microservice architecture, you can collect hundreds of metrics – but not all of them are helpful. Focus on what actually impacts system health and user experience. The most widely used categories include:
Golden Signals
- Latency – How long does it take to respond?
- Traffic – How many requests are served?
- Errors – What percentage fail?
- Saturation – Are resources overloaded?
Originally popularized by SRE teams, these signals are widely adopted across monitoring tools and open source platforms.
Resource Metrics
Track CPU, memory, disk, and network usage per service or container. These are still important, especially when diagnosing performance issues. In Kubernetes environments include pod-level and node-level metrics for full visibility.
Custom Business Metrics
Measure what matters to your business: Orders processed, messages sent or failed logins. These metrics help you to link technical health to business impact.
Best Practices for Monitoring Microservices
Monitoring microservices isn’t just about collecting data. It’s about making that data useful. Here are proven practices to help you stay in control:
- Correlate Metrics, Logs, and Traces
These three data types give you different views of system behavior. Linking them allows faster debugging and better root cause analysis.
- Use Unique Request IDs
Pass a request ID through each service call. This lets you trace a single user request across dozens of services and log files.
- Alert on Symptoms, Not Just Failures
Don’t just alert on low-level thresholds. Alert when latency increases, error rates spike, or saturation indicates a near-failure state.
- Monitor Inside Containers
Check that critical processes are running inside your containers, not just whether the container is up. Consider process health, memory leaks, or logs that indicate issues.
- Build Monitoring Into Development
Add instrumentation early, define alert thresholds during development, and test observability before deploying.
Monitoring Tools for Microservices: What to Look For
There’s no one-size-fits-all tool. Instead, you need a stack of tools that cover different layers. You will find some examples below in the table.
| Category | Purpose | Examples |
| Metrics Monitoring | System & service metrics | Icinga, Prometheus |
| Logging | Centralized log management | Loki, Elasticsearch, Fluentd |
| Tracing | Request flow across services | Jaeger, OpenTelemetry |
| Visualization | Dashboards & data correlation | Grafana, Kibana |
When choosing tools, look for integration, flexibility and scalability. Open Source tools give you control, but require some setup. Cloud-native platforms offer speed but less customization. Find what fits your team and infrastructure best from a long-term perspective.
Microservice Monitoring in Practice: A Step-by-Step Workflow
Monitoring microservices is not just about tools – it’s about how you connect the dots. Here’s a simplified workflow you can apply to most environments:
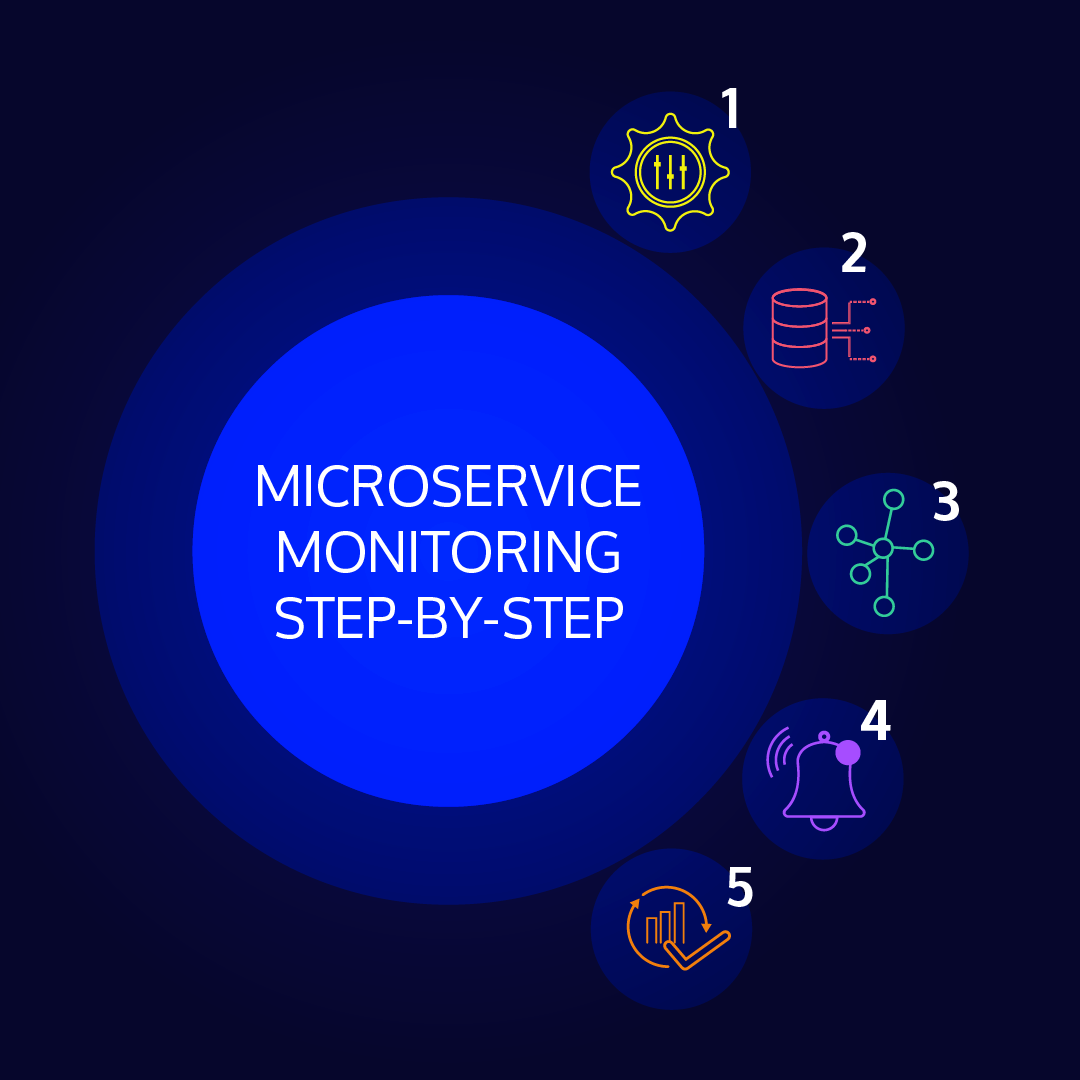
- Instrument Your Services: Expose metrics and traces using standards like OpenTelemetry.
- Collect Data from All Layers: Gather logs, metrics, and traces from services, containers, nodes, and infrastructure.
- Correlate Data Across Services: Use request IDs and service tags to group data meaningfully.
- Set Smart Alerts: Alert on user-facing issues, not just raw numbers.
- Review, Learn, Improve: Use insights to fix root causes and refine your system.
FAQs: Monitoring Microservices
How do I choose the right microservice monitoring tools?
Focus on what you need: metrics, tracing, alerting, or visualization. Open Source tools like Icinga for Kubernetes and Prometheus, especially when used together, are powerful and flexible and can be extended to monitor container platforms and Kubernetes environments as your architecture evolves.
What are common mistakes in microservice monitoring?
- Monitoring only infrastructure, not services
- Ignoring service dependencies
- Alerting on everything – or nothing
The fix: monitor what impacts users, correlate your data, and keep alerts actionable.
How can I monitor microservices without getting overwhelmed by data?
Use request IDs to group events. Focus on a few key signals – like latency and error rate. Build dashboards that highlight impact, not noise. Keep in mind: Less data, more insight.

