Icinga is designed to be a highly dynamic monitoring software that can monitor your setup, regardless of its architecture. While most setups are hierarchical and fit well into the master,...
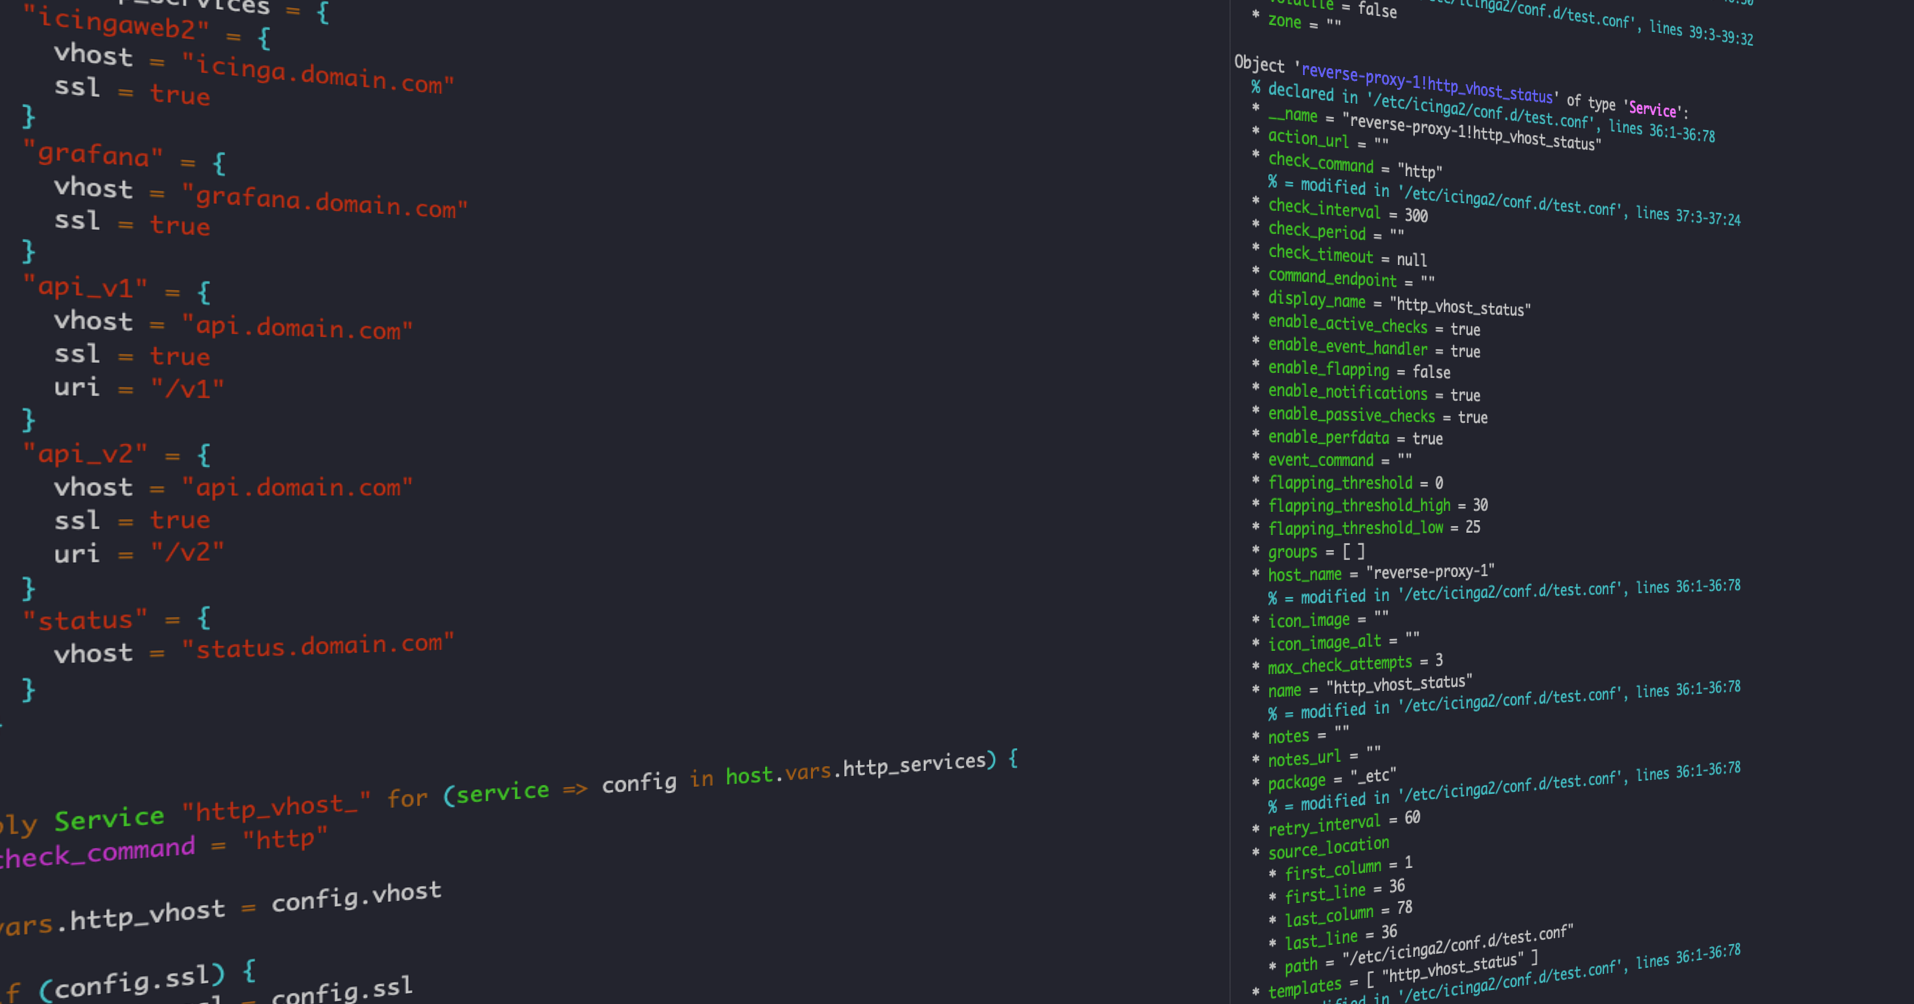
Monitor One Icinga 2 Cluster From Another
Icinga is designed to be a highly dynamic monitoring software that can monitor your setup, regardless of its architecture. While most setups are hierarchical and fit well into the master,...

Drowning in Alert Fatigue? How to Regain Control of Your Monitoring
Introduction: Why Alert Fatigue Hits Sysadmins Sooner or Later If you’ve ever muted your phone during a maintenance window, only to miss a real outage an hour later, you’re not alone. Sysadmins on Reddit and beyond often describe feeling like they’re drowning in...

Ipl-html: Introducing new Form Element Decorators
A Fresh Take on Form Element Decorators Decorators have always been a powerful concept in Icinga Web’s form system — letting developers control how form elements are displayed without hardcoding markup everywhere. But until recently, the decorator system had its...

Bring your own CI/CD.
As a developer I couldn’t imagine working without one of these three things: a search engine – which saves me thinking by myself an IDE – which saves me typing function names completely and continuous integration – which saves me running unit tests by myself on every...

Monitoring the Monitor: How to keep a watch on Icinga 2
The question is (probably) older than monitoring itself: Who monitors the monitor? While Icinga comes with countless options to monitor a wide range of devices and applications, at some point you will ask yourself how you can observe if Icinga itself is having errors....

Creating a Business Process and adding it to Dashboard
In this blogpost I will introduce, how to create a business process from monitored hosts and services and how to add them to dashboards. Business Process module is an interesting module in Icinga Web 2. It allows you to visualise and monitor hierarchical business...

Calculating a state over multiple services
These days many setups have a lot of redundancy and you may not want to send notifications during the night, just because one of multiple http servers has a problem. This blog post will show you how to setup a single service with a state combining multiple other...
Debugging Filters and Apply Rules using the Script Debugger
Have you ever been in a situation where something in your Icinga configuration did not work as expected and you ended up doing small changes and reloading Icinga over and over again? This can be especially tricky with apply rules and filters if they don't match the...

Revoke certificate of an Icinga endpoint
A Certificate Revocation List (CRL) is a list of certificates that have been revoked by the issuing Certificate Authority (CA) before their scheduled expiration date. Those certificates should no longer be trusted. A client application such as an Icinga Agent can use...
Using the Icinga Web API
Unfortunately, there is little to no documentation for using the Icinga Web API to perform monitoring actions such as scheduling downtimes. But it's a simple thing and I'll give you a quick example of how to do it. Using the Icinga Web API instead of the Icinga API...

Using Thola for monitoring your network devices
This is a guest blogpost by Alexander Biehl from the Thola development team. --- Once upon a time there was a small company in the south west of Germany that used an old check plugin for monitoring its network devices. But as their network got bigger and bigger over...

Docker: You’ve got mail!
So far we’ve chosen base images for our Icinga 2, Icinga Web 2 and Icinga DB Docker images, further reduced the image size and even taken care for security and comfort. Additionally Eric put all the images together via Docker Compose. But there’s still one little...

Subscribe to our Newsletter
A monthly digest of the latest Icinga news, releases, articles and community topics.
