Today, we are going to look at a few things related to handling secrets. While Icinga 2 has no dedicated mechanisms for secret handling, there are a few tricks you can do with standard features....

Tips and Tricks for Handling Secrets in Icinga 2
Today, we are going to look at a few things related to handling secrets. While Icinga 2 has no dedicated mechanisms for secret handling, there are a few tricks you can do with standard features....

Get Valid TLS Certificates for Icinga Web Despite a Firewall
Lots of big companies lock down their IT infrastructure in the internal network, sometimes they even use only locally mirrored repositories. I totally understand this, especially since our CVE-2024-49369. Nowadays, when LLMs find security holes even in OpenBSD, you...

Icinga 2 Meets OpenTelemetry: Native Metrics Export in v2.16
The OTLPMetricsWriter is a new Icinga 2 feature available since v2.16 that exports check plugin performance data as OpenTelemetry-compliant metrics via the OTLP HTTP protocol. With a single configuration object, it connects Icinga 2 to any OTLP-compatible backend like...

Effective Monitoring Strategy: 10 Tips for Success
As a software developer in training at Icinga, I've learned a lot about the nuances and importance of monitoring systems. Effective monitoring is critical for maintaining the health, performance and security of any infrastructure or application. Here are ten essential...
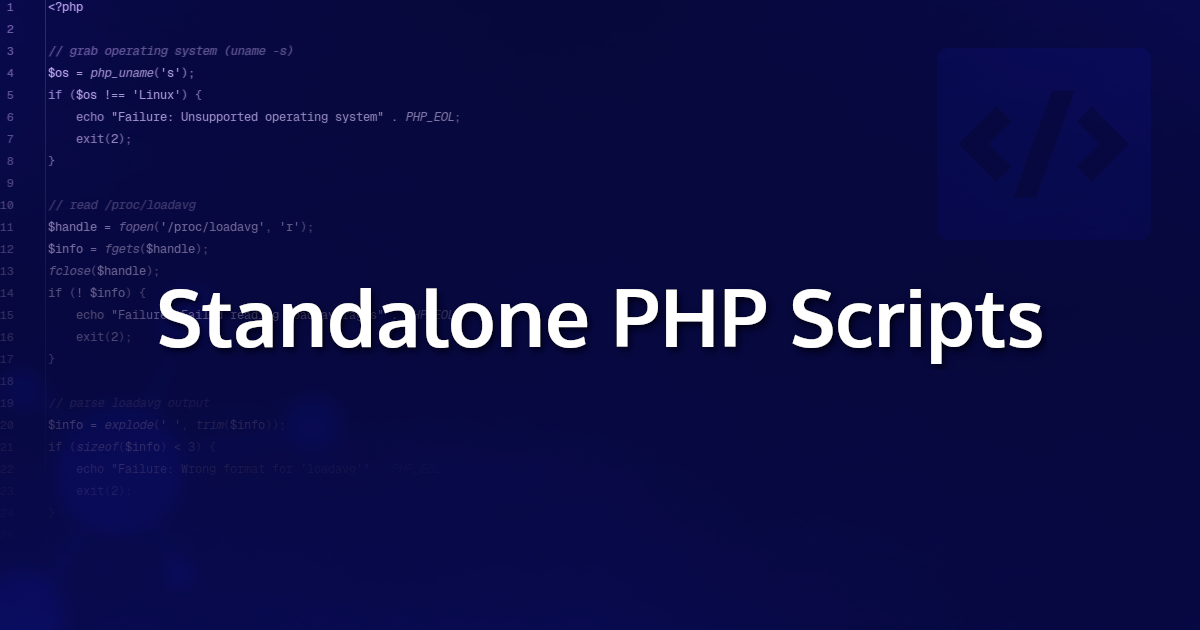
Native Binaries with PHP
There is always a big debate about whether interpreted or compiled languages are more useful. I think it is important to look at the pros and cons. Both language types have their strengths and weaknesses. While interpreted languages are great for maintaining and...

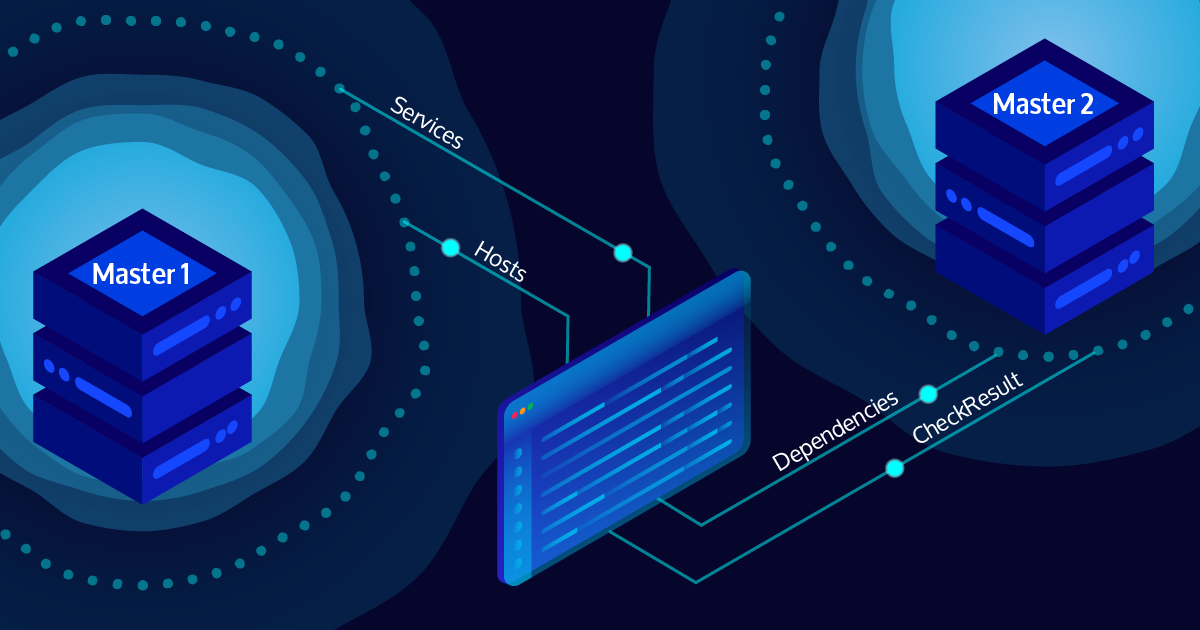
Making Use of Previous State in Icinga2 Check Commands
When writing a custom check plugin for Icinga 2, there are situations where in addition to observing the current state of a system, taking the past into account as well can be helpful. A common case for this is when the data source provides counter values, i.e. values...
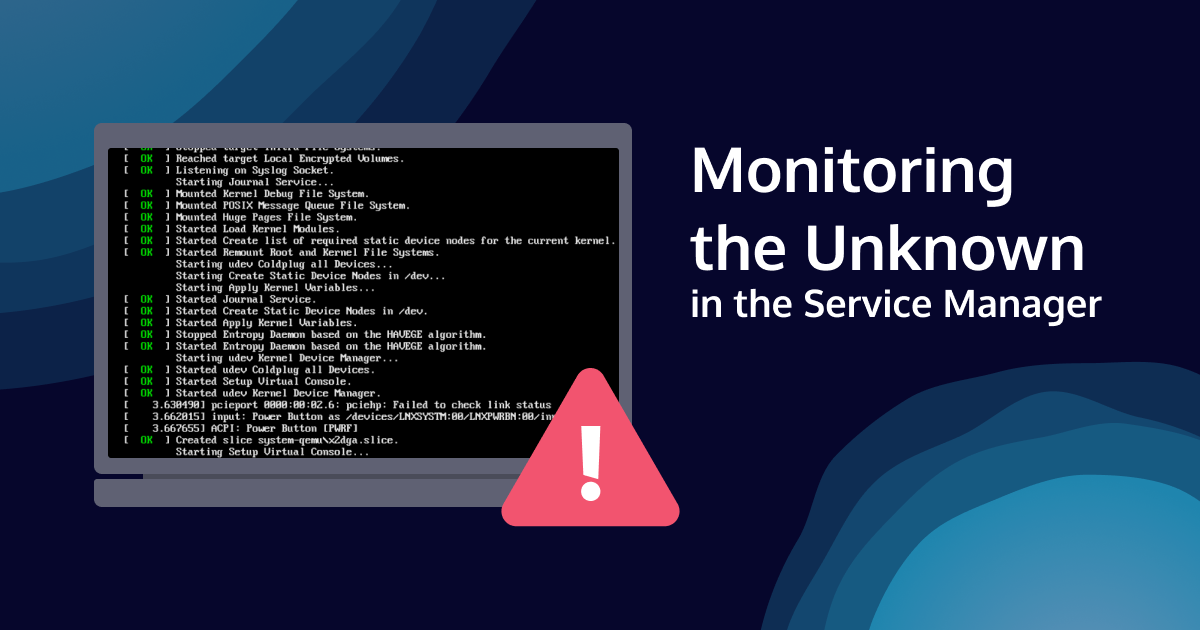
Monitoring the Unknown in the Service Manager
Nearly every operating system comes with at least one kind of service management. On a Unix-based operating system, this is historically part of the init system. While the specific tools have matured over time and there are changes between operating systems, they are...

Tutorial Videos on How to write your own Icinga Web module on YouTube!
Have you ever wanted to extend the functionality of Icinga Web to suit your specific needs, but didn't know where to start? Well, you're in luck! Last week, we released a series of tutorial videos on YouTube, hosted by Markus Opolka, Senior Consultant at NETWAYS,...
Icinga 2 API and debug console
Have you ever experienced configuration issues, such as notifications not being sent as expected or apply rules not matching all expected objects, probably due to an incorrectly set custom variable? Icinga 2 has several options to assist you in such situations. Last...

IPL: How to use ipl-web
In my ongoing blogpost series about the Icinga PHP library, I am briefly explaining what the individual components of this library do and how easily you can use them in your project. In my previous blog post, i already covered the ipl-html and explained how easy it is...
Icinga 2 API with Let’s Encrypt certificates, just for fun
In our community forum Michael already outlined the possibility to operate Icinga 2 with an external certification authority, not the one Icinga 2 generates by itself. Thomas, one of our NETWAYS colleagues, reported his experience in that field: in short, it's easy to...
IPL: How to use ipl-stdlib and ipl-i18n
In my previous blogpost, I explained how easy it is to validate forms with the ipl-validator. Today we will talk about the following two very useful libraries: Ipl-stdlib: All our libraries are based on this library. It provides many useful features like string...

Subscribe to our Newsletter
A monthly digest of the latest Icinga news, releases, articles and community topics.
