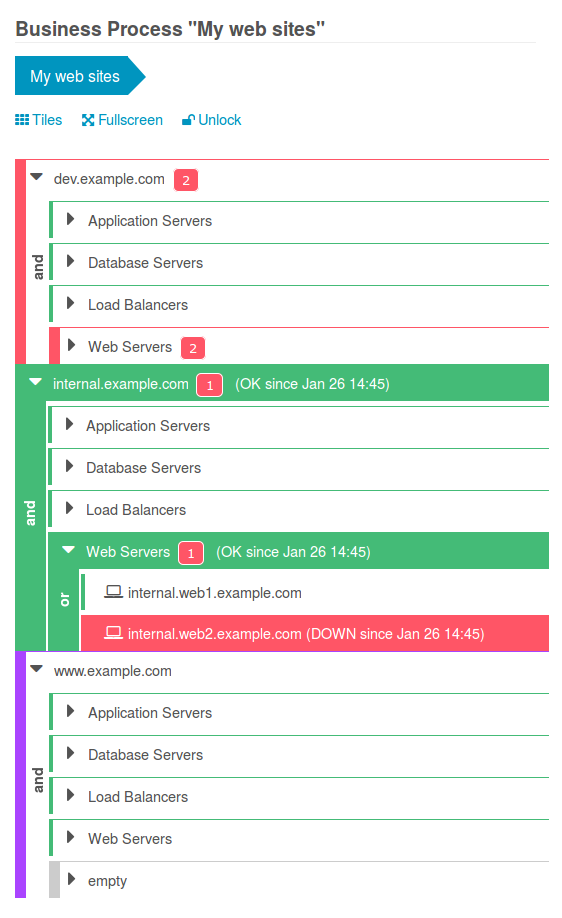
 Want to visualize part of your IT infrastructure in a hierarchical way? Do you know the Business Impact of single services? What would happen in case you power down a specific server? Would it have any influence on your most important services? If yes, which applications would have been affected? This is what the Icinga Business Process module has been built for.
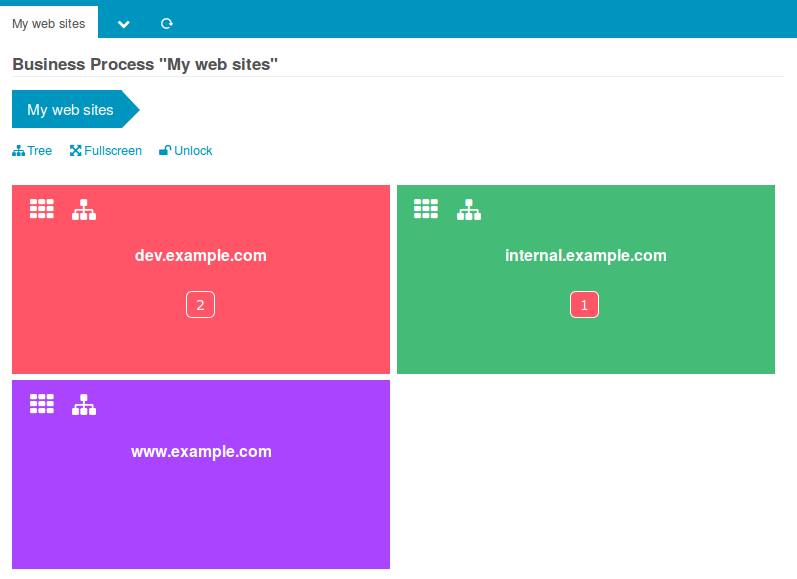 Define as many processes nested as deep as you want: each node can calculate it’s own state based on a given logical operator. Show them as a tree or using the tile renderer. Discover the business impact of your components, simulate state changes and deploy Icinga Service Checks and Notifications. Start to monitor whole processes instead of single services.
Sounds promising? Then please head on to our documentation. It is packed with lots of screen shots showing how to get started – and much more.
Let me just add a few more screens right here. Our split view, the Business Process Dashboard, a modified process and some processes in a custom Icinga Web 2 Dashboard:
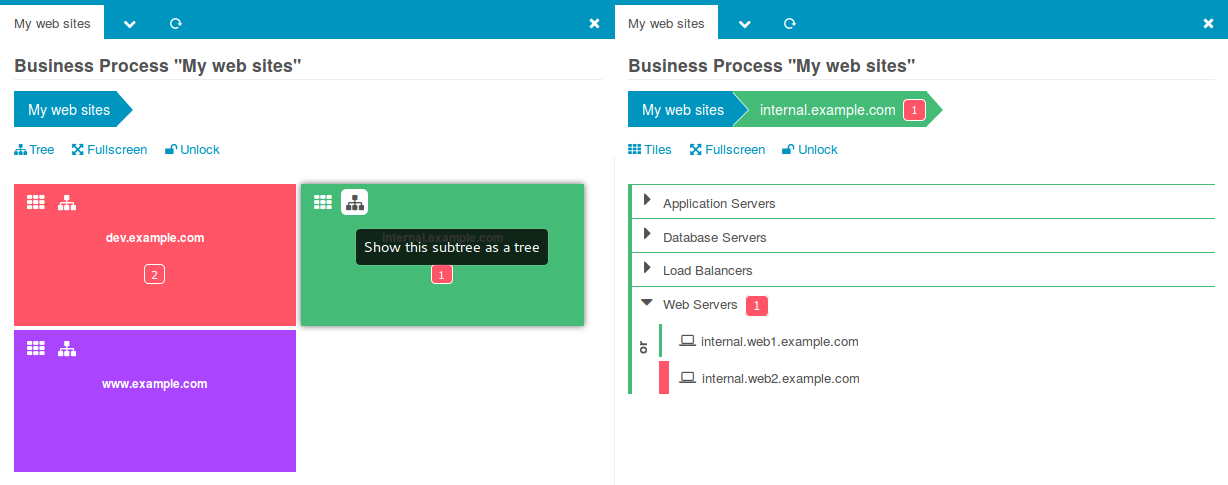
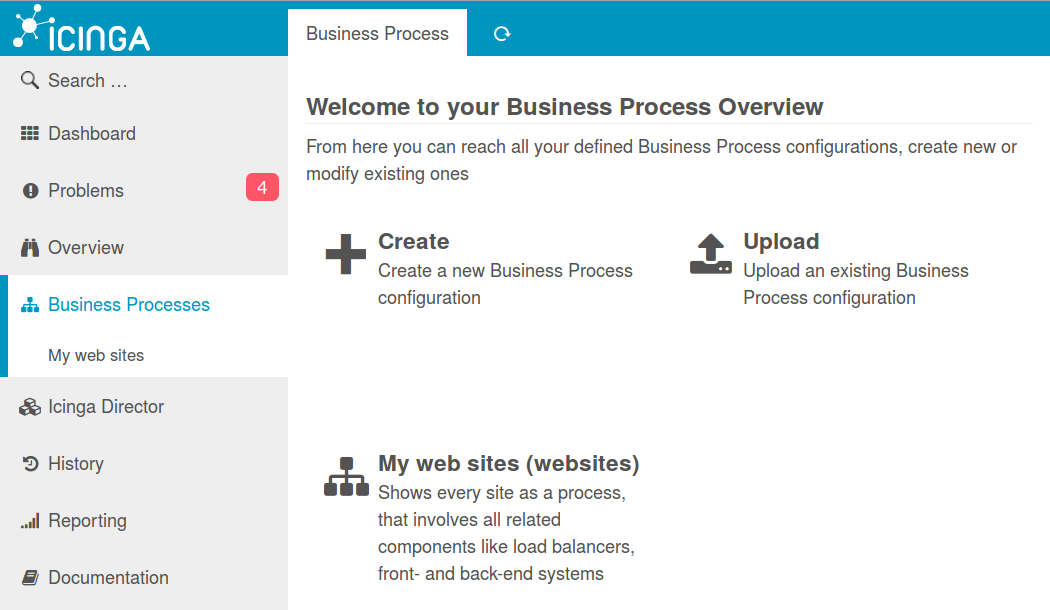
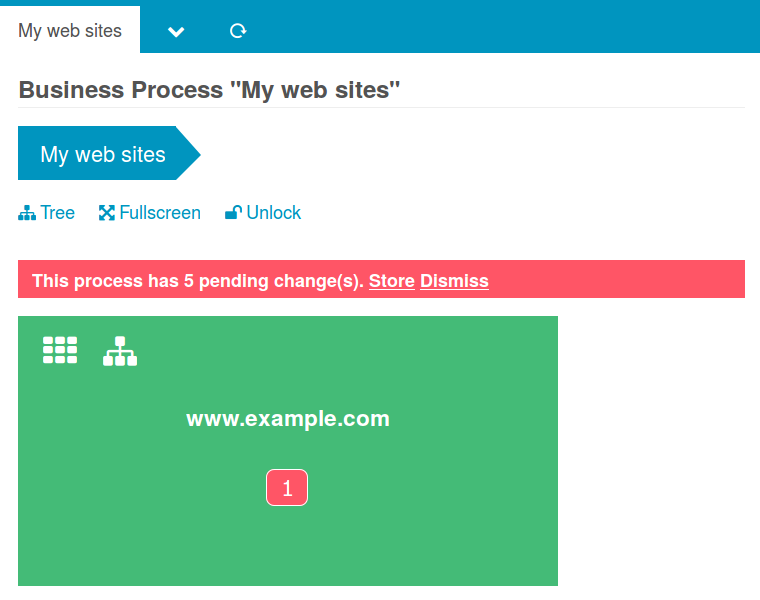
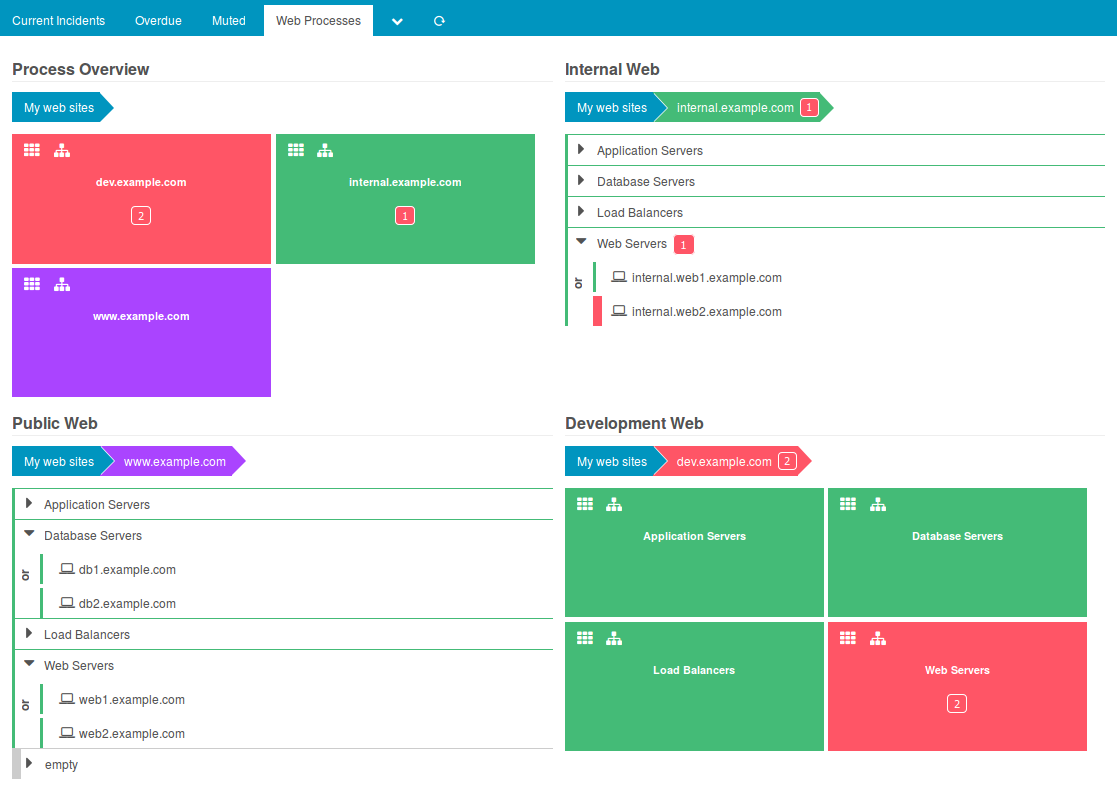
And there is more. Config Diff, breadcrumbs everywhere, lot’s of hidden features:
Let’s stop here. For more images please check our documentation (I already mentioned it, did I?), download and install the Business Process module right now!


