With Icinga Reporting you can create custom SLA reports for hosts and services that are monitored with Icinga. The module for Icinga Web fetches existing data and takes planned downtimes into account. You can filter for certain hosts and services as well as set custom thresholds to highlight unmet SLAs visually. You decide if you want to create the reports either manually or automatically, for example every week or month. The report then is sent to you as a PDF via email.
Today I want to share a quick tip on how you can customize the look of the report with custom templates. This feature is pretty useful when sending the reports to managers or customers.
Reporting templates
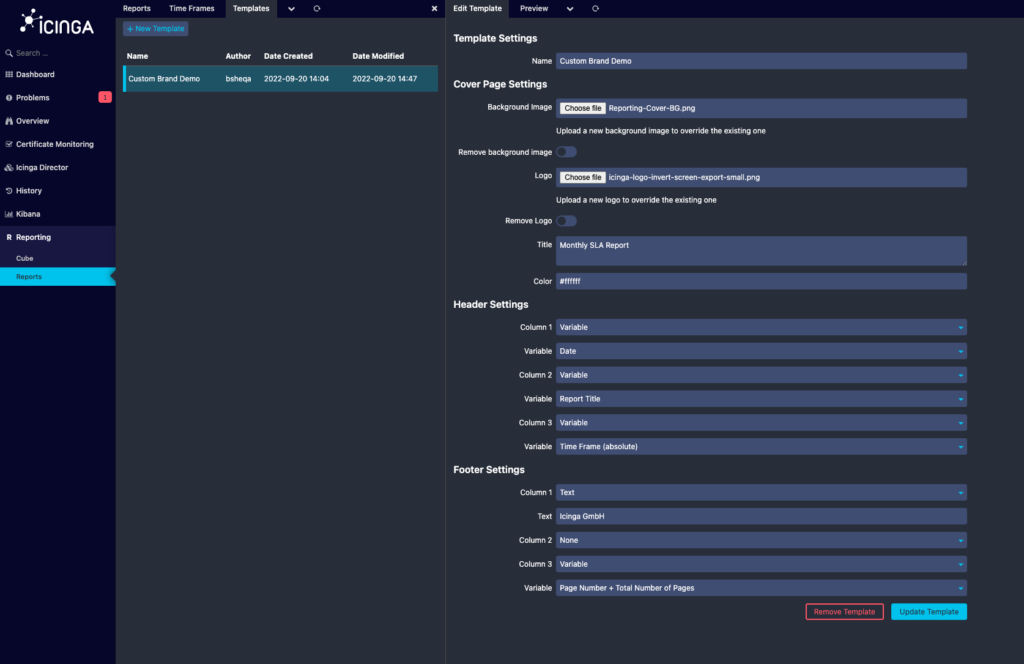
By default, Icinga Reporting will generate the PDFs with a plain white background without a cover page. However, you can customize many parts by creating a custom template within the “Template” tab.
Cover Page Settings
The cover page is the first page of your report. You can define exactly how it should look like by configuring the following settings:
- Background Image: This image will be used as the background. It may be anything between a single color and a sophisticated background image.
- Logo: This image will be placed in the center of the cover page.
- Title: A custom title for the report. This title will be placed right below the logo.
- Color: This color will be used for the title.
Header / Footer Settings
The header and footer are split into three columns each (left, center, right) and each column can be configured with custom properties to customize the report:
- Text: Free text, type in whatever you want.
- Image: Add an image, for example a small version of your logo.
- Variable: Use build-in variables that are rendered depending on the current state
- Report Title: The title you set in the “Cover Page Settings”
- Time Frame: The relative time frame as configured in the report (eg. Last Month, Last Year, …)
- Time Frame (absolute): The resolved time frame which indicates the exact time frame of the report
- Page Number: Page number depending on the page
- Total Number of Page: Total amount of pages, depending on the size of the report
- Page Number + Total Number of Pages: A mix of both
- Date: The date on which the report was generated
-

- Cover Page

-
- Custom SLA Report
Get Started
Installing Icinga Reporting is pretty straight forward, check out the installation docs. While the module required additional database schemas when used with the IDO, this is not required anymore with Icinga DB, which makes the installation even easier. I’m looking forward to receiving your feedback on GitHub so we can make Icinga Reporting even better.