To ensure the reliability and stability of your services, it’s essential to understand the overall health of your infrastructure and systems. That variety of information from your systems helps you to get a proper context during your root cause investigation and react in real time. But also gives you the ability to make changes with confidence, so you don’t encounter the same problem in the future. One of the best ways to gain this insight is through a robust monitoring system that collects metrics, visualizes data, and alerts you when something seems amiss.
What are Metrics?
Metrics are the raw data of resource usage or behavior that can be observed and collected in your systems. They may be simple summaries of usage provided by the operating system, or higher level data tied to the specific functionality or work of a service. Such as requests per second or database connections e.g the number of open connections running simultaneously that may overload the server and slow down the performance. Some metrics are presented in relation to total capacity, while others are presented as a rate indicating the utilization of a service. It is easiest to start with the metrics already provided by your operating system to show the usage of the underlying physical resources.
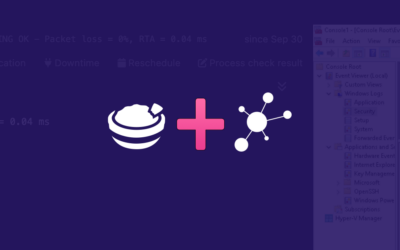
Icinga checks not only the status of your infrastructure, but also collects metrics, like disk space, CPU utilization, swap usage, load, etc. and forwards to a Graphite or InfluxDB without much additional effort. You can then visualize your metrics stored in Graphite or InfluxDB in the Icinga Web interface or Grafana. The types of assets you monitor and the information you track will likely keep changing as your infrastructure evolves. Depending on the source of metrics placed in your infrastructure hierarchy, it can be useful to think about the metrics available at the following different levels when planning your monitoring strategy.
Host/System Metrics
Host-based indicators can cover anything related to measuring the health or performance of an individual host, other than the services it offers. Monitoring host metrics can give you an idea of what factors may be affecting a computer’s ability to perform assigned tasks. These metrics mainly measure the usage or performance of the operating system or hardware, like:
- CPU Metrics
- Memory Metrics
- Disk Metrics
Network performance Metrics
Across most infrastructure types, network and connectivity performance indicators are another set of data worth examining. They are important indicators of being available to the outward appearance of the network. But they are also important for ensuring that services are accessible to other computers for all systems that include more than one system. Like host metrics, networks should be examined for their overall viability and fitness to perform as required:
- Average inbound and outbound Packets
- Availability
- Connectivity
- I/O & Avg. Packet lost
Application/Service Metrics
The application metrics are another type of performance metrics. They indicate whether the application is working correctly and efficiently. Application metrics are gauges of application health, performance, and load, such as:
- Error rates
- Request rate
- Average response time
- Latency & Application Availability