The question is (probably) older than monitoring itself: Who monitors the monitor? While Icinga comes with countless options to monitor a wide range of devices and applications, at some point you will ask yourself how you can observe if Icinga itself is having errors.
The Basics
To start with “monitoring the monitor” it is helpful to begin with some basic checks to make sure your monitoring environment is up and running. Icinga consists of multiple components and some of them require additional software packages. You may refer to the following list to build a quick overview over some basic parameters.
Since Icinga is running on your own servers (usually) it’s helpful to monitor those Icinga servers the same way like you monitor the rest of your infrastructure. This means adding basic checks for the system and the operating system like:
- Utilization of: RAM, CPU, Disk and Processes
- Available updates for the operating system
- Remote connectivity via SSH
- Remote connectivity of Icinga Services:
- Icinga Web: Port 80 and 443
- Icinga 2: Port 5665
- Time synchronization
- Configuration automation tools such as Puppet, Chef and similar
- Hardware such as RAID controllers and IPMI
You should take care that especially the checks regarding remote connectivity are executed by another Icinga 2 instance, for example an Icinga Satellite. Of course there may be additional checks required depending on your hardware, software and type of installation. Anyways, following that list is a solid start to get a rough understanding about your monitoring setup.
Get more Insights
Additionally to the mentioned basic checks it’s recommended to monitor metrics that give you insights about the internals of Icinga 2. Those metrics are provided by a couple of built-in checks that come with each Icinga 2 installation and can be used out of the box.
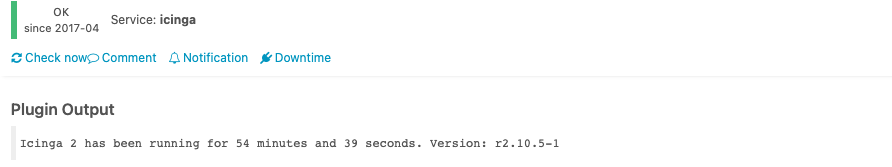
Check: icinga
The icinga check returns performance data for the Icinga instance and reports a warning if the last reload failed. Optionally the check allows you to verify the installed version of Icinga 2 and report if it does not match your requirement.
The check comes with plenty of performance metrics that give you insights about:
- Amount and type of executed checks
- Amount and type of returned results
- API utilization within the cluster
- Throughput of enabled writers such as Graphite and Influxdb
- Performance of IDO
- Many more …
Storing these metrics in your time series database will help you understand how Icinga 2 is performing and support you in your decision if you need additional Icinga 2 instances.
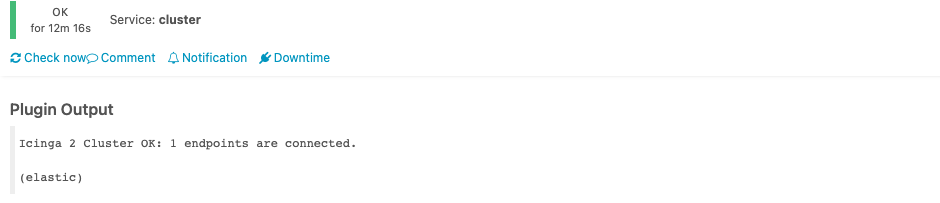
Check: cluster
Understanding a single Icinga 2 instance is important. If you have a distributed setup with Icinga Satellites and Agents it’s crucial to know if those endpoints are actually connected to their parent. With the built-in cluster check you can do exactly that. This check returns performance metrics for the current Icinga 2 instance and additionally information about connected endpoints.
Check: cluster-zone
Additionally to the cluster check, Icinga 2 comes with the cluster-zone check. The cluster-zone checks provides metrics about the throughput of messages shared within a zone and additionally allows you to get notified if the communication is lagging. Lagging messages within a zone can be an indicator of poor network connectivity and may result in late delivery of check results.
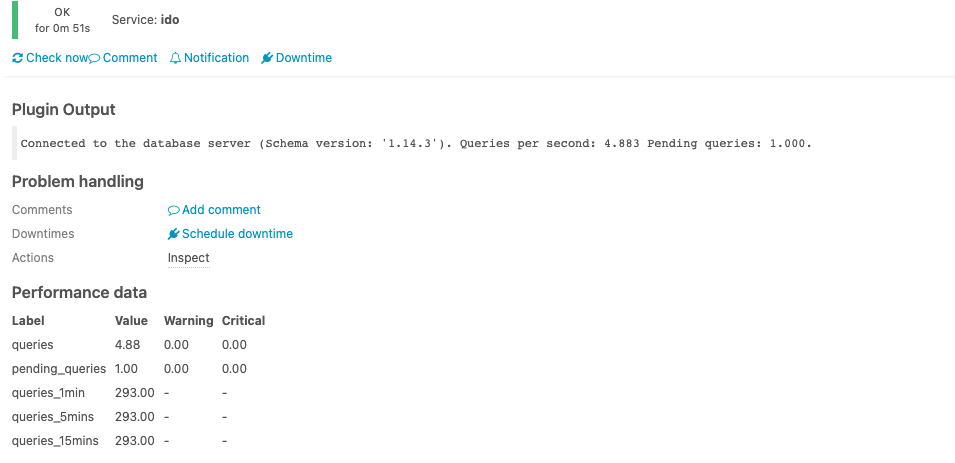
Check: ido
The icinga checks already provides metrics about the performance and throughput of the IDO. With the built-in ido check you can push this further and get notified if the throughput is to low or if there are too many pending queries. Too many pending queries will result in missing information in your Icinga Web, which makes it pretty difficult to understand and react to occurring errors in your infrastructure.
Monitoring from Remote
Now you may say: How does that help if my main Icinga 2 instance is not running? And you’re right. The most common practice to solve this situation is to run an Icinga 2 instance on independent hardware, at best in a different cloud or datacenter. Without a doubt Icinga is the best choice to monitor another Icinga, because it comes with everything required to get a full picture and deep insights about your monitoring environment.
To make the process more comfortable we partner with NETWAYS to provide cloud based Icinga 2 Satellites that can easily be added to your existing monitoring landscape.