With the development of Icinga DB we not only rebuilt the core of how Icinga stores and reads monitoring data. With a complete rebuild of the monitoring module we took the chance and refined most aspects of the user interface as well.
One aspect that got attention is the display of downtimes, using their time based nature and putting the resulting data into context and visualizing it.
Here are some of the details.
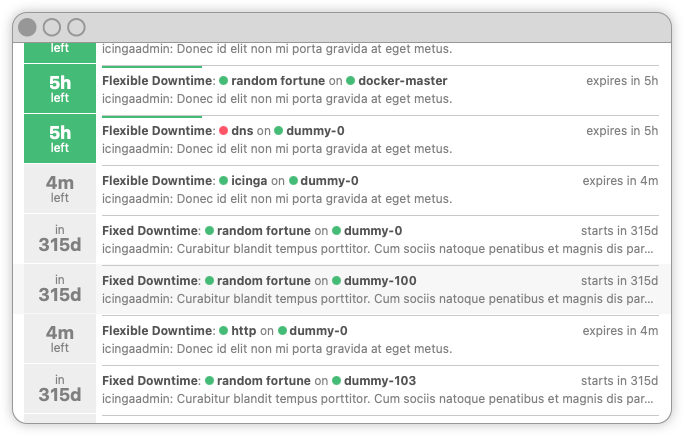
Icinga DB Web Downtime List
The downtime list was redesigned to have more relevant data at hand, when showing your scheduled downtimes. You now see which downtimes are currently active on first sight. Active downtimes feature a green visual, that also shows the time remaining. You also have written out in the title, whether the downtime is fixed or flexible.
Detail Header
The detail header now delivers a compact header element with the most relevant information at hand.
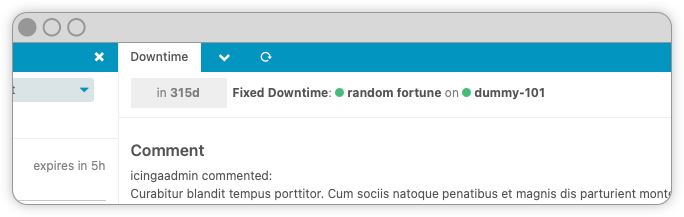
Icinga DB Web Downtime Detail Header
Detail View
Besides all the detail data attributes the detail view also features a time based widget, putting all the raw attributes in context.
The widget for a fixed downtime is pretty straight forward, displaying the start/end times and a progress bar.
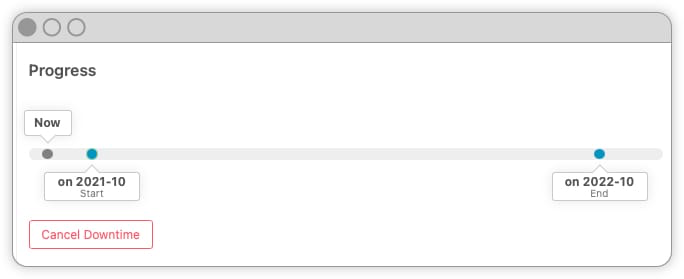
Fixed downtime widget
A little more complex is the widget for the flexible downtime.
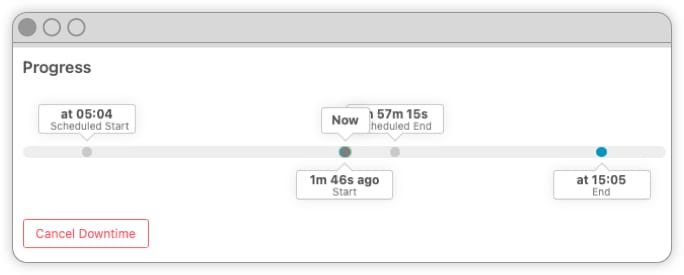
Fixed downtime widget
We hope you love the refined downtime list design and the new widgets.
If you want to try it for yourself, just have a look at the Icinga DB Web Documentation.