In late 2019 we were running our first ever user survey on Icinga. We always strive to get to know our users and their requirements better. Our goal for the survey was to get a general understanding about how Icinga is being used. The results are very interesting for us and will help us to make decisions. Today we want to share the results of the survey.
The Survey Participants
First of all, we want to set the base by understanding who took part in the survey, how they interact with Icinga and how frequently the survey participants use Icinga.
Managing Icinga
Next, we follow-up with some questions about how Icinga is installed, updated and configured. This includes the installation of Icinga and also the management of the configuration.
Common Icinga Setup
In this section we were asking questions about the Icinga setup, including some details about Icinga Modules and the amount of hosts that are monitored with the setup.
Icinga Integrations and Notifications
Icinga integrates very well with many other tools. We wanted to know what is being used for logging and graphing. Additionally, we asked about the type of notifications that you use.
Monitoring Practice
The final questions were about what you actually monitor with Icinga. We split the questions into the categories Operating Systems, Application Monitoring, Hardware and Sensors and Cloud and Container.
Final Thoughts
The survey was very helpful for us. Of course we knew many of the details previousley, due to conversations we have with our community and our customers. But there are also some interesting insights included which we would not have expected. For the future, we would like to run the survey once a year to be able to understand changes during the time.
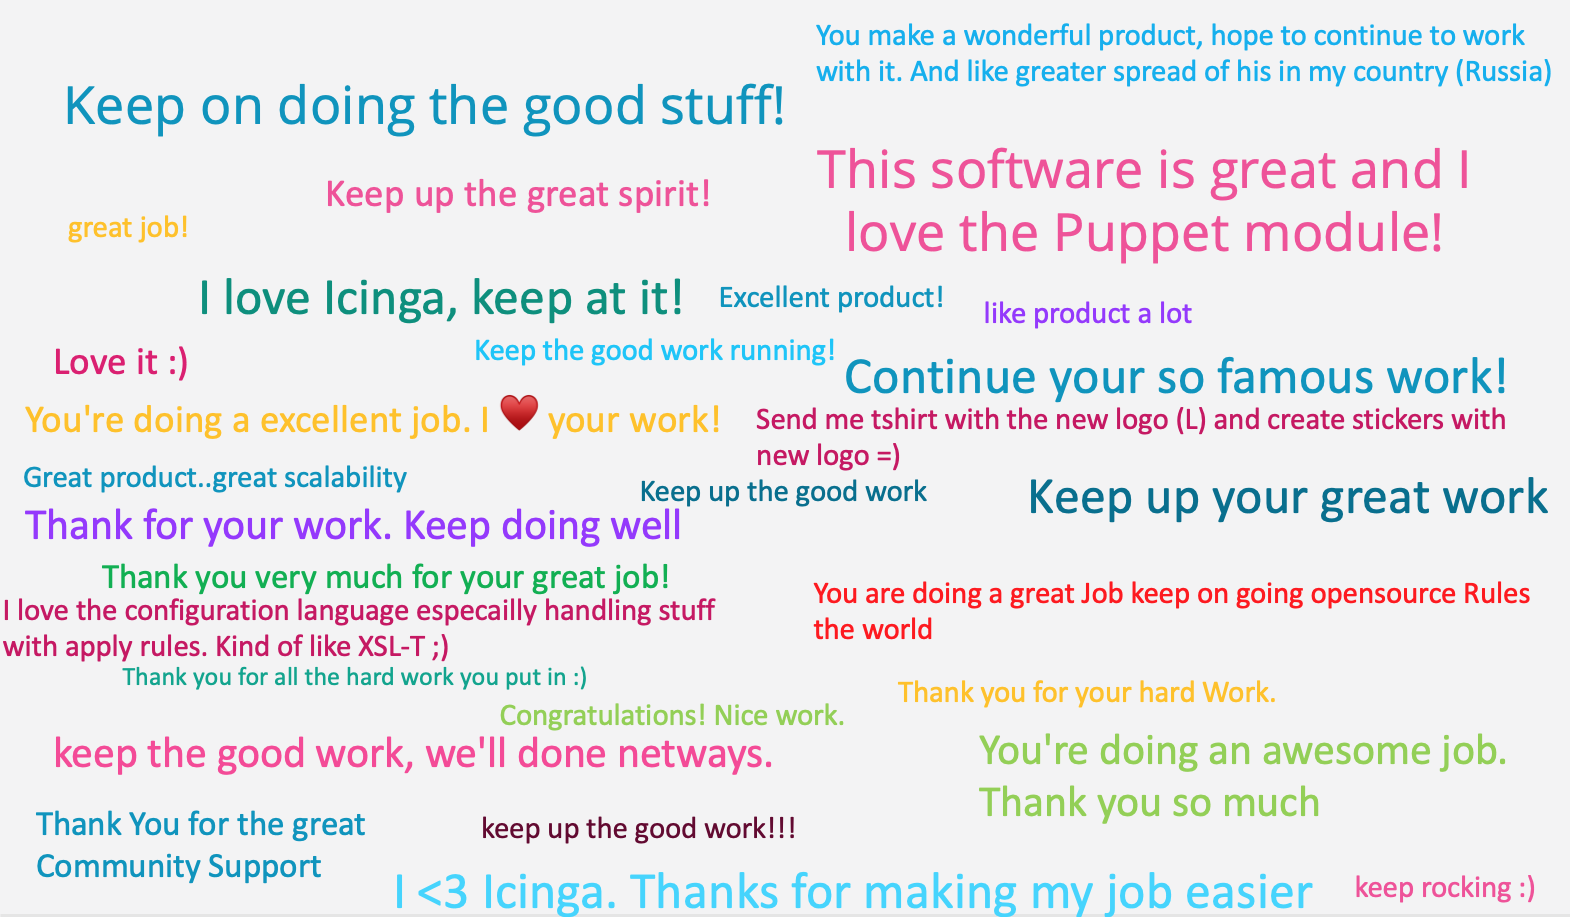
In our last question we received an overwhelming amount of positive feedback, which we tried to catch in a picture. We want to say thank you back for taking part in the survey and for your trust in Icinga!


