When your Linux system feels sluggish, one of the first things to investigate is the CPU usage. The CPU (Central Processing Unit) is the brain of your machine, and if it’s overloaded, everything else slows down. In this guide, you’ll learn different ways to Linux check CPU usage with command-line tools, how to interpret the metrics, and why automatic monitoring with Icinga ensures long-term system stability.
What is CPU Usage and Why It Matters
CPU usage refers to how much of your system’s processing power is being consumed at a given moment. Keeping an eye on it helps you understand system performance, spot bottlenecks, and prevent downtime.
A high CPU utilization can be caused by:
- Heavy applications like databases or virtualization software.
- Misconfigured processes that run wild (e.g., memory leaks or runaway loops).
- Background jobs such as indexing or backups.
- Malware or unwanted processes.
Understanding how to check the CPU usage in Linux is essential for both troubleshooting and proactive performance management.
Checking CPU Usage on the Linux CLI
The Linux command line offers simple but powerful tools to show CPU usage in real-time.
Using top
Run the command top on the Linux CLI
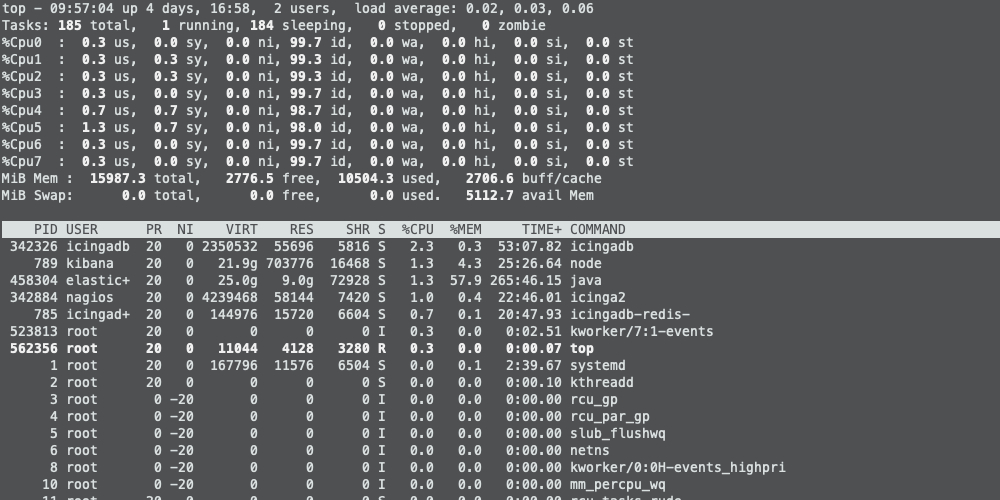
This shows a dynamic, real-time view of processes. CPU usage is displayed at the top, with per-process details below.
Using htop
If you want a more user-friendly interface, try htop (install it first with sudo apt install htop or sudo yum install htop):
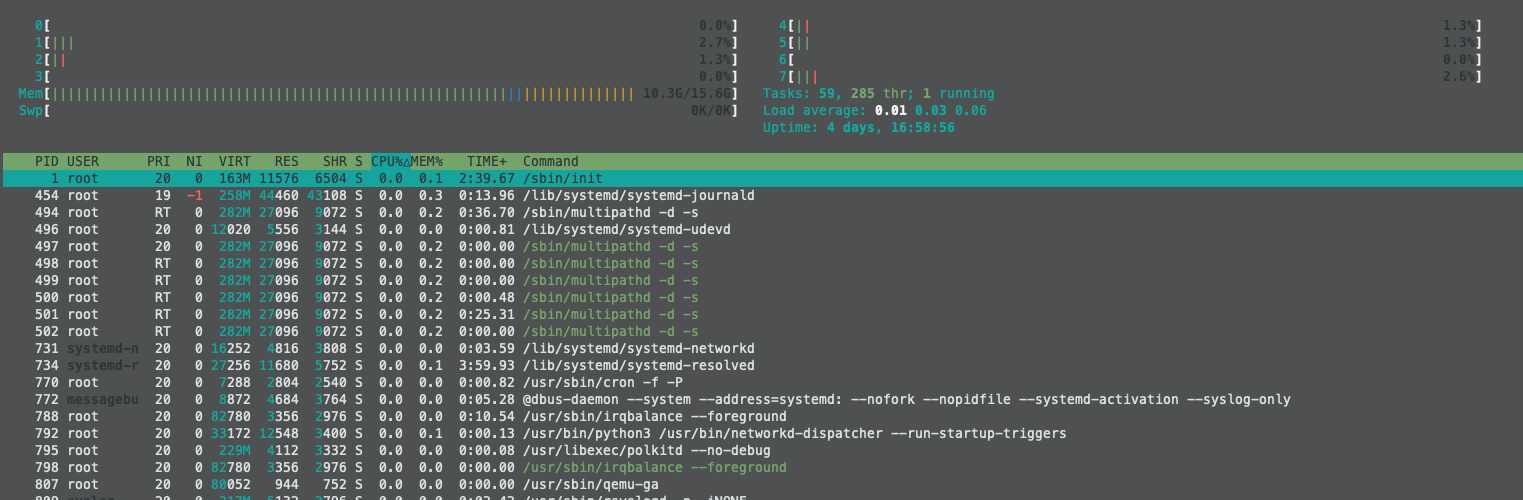
htop uses colors and graphs, making it easier to see CPU usage at a glance.
Understanding the CPU Usage Metrics
When running top or htop or related commands, you’ll see a breakdown of CPU states:
- us (user): Time spent running non-kernel code (applications).
- sy (system): Time spent running kernel code.
- ni (nice): Time spent on processes with manually adjusted priorities.
- id (idle): CPU waiting with nothing to do.
- wa (IO-wait): Time waiting for I/O operations, like disk reads/writes.
- hi (hardware interrupts): Time spent handling hardware interrupts.
- si (software interrupts): Time spent handling software interrupts.
- st (steal): Time “stolen” by the hypervisor when running virtual machines.
Knowing these helps you interpret whether high usage comes from applications, the kernel, or I/O bottlenecks.
Why per-CPU Usage Matters
By default, tools like top show you the average CPU usage across all cores. On multi-core systems, this can be misleading because one core might be overloaded while the others remain idle. If a single-threaded application maxes out just one CPU, the system can feel slow, even though the overall average looks fine. To get the real picture, it’s best to view the usage of each core individually – for example, by pressing 1 in htop.
Monitoring CPU Usage Automatically with Icinga
Manual checks are useful for quick troubleshooting, but in production you need continuous visibility. Icinga automates CPU monitoring across your infrastructure.
With Icinga you can:
- Define thresholds (e.g., alert when CPU usage > 85%)
- Get notified before issues impact users
- Store metrics for historical analysis and capacity planning
- Combine CPU data with other monitoring signals like memory, disk, or network performance
For Linux hosts, Icinga’s official monitoring plugins make it straightforward to check CPU usage, integrate results into dashboards, and trigger automated actions.
To go beyond basic CPU checks, explore Icinga Metrics & Logs. It provides a centralized way to collect and analyze CPU performance data alongside logs, helping you spot patterns and correlate issues across your infrastructure.
Final thoughts
Whether you’re running a personal server or managing enterprise systems, knowing how to check CPU usage in Linux is a vital skill. Use tools like top and htop for quick checks, dig into the metrics to understand the cause, and rely on Icinga for enterprise-grade, automated monitoring. This way, you’ll always be in control of your system’s performance.
CPU Usage FAQs
How can I quickly see CPU usage on Linux?
Run top or htop in the terminal to see real-time CPU usage.
How do I find CPU usage by each core?
In htop, you will see the per-core statistics by default. In top, press 1 to toggle per-CPU stats.
Why does my CPU usage stay high even when I’m not doing anything?
It could be background processes, scheduled tasks, or an application stuck in a loop. Use top to see which process consumes the CPU.
What’s the best way to monitor CPU usage long-term?
The best way to automatically monitor CPU usage is to use a monitoring tool like Icinga to check CPU usage and alert you when thresholds are exceeded.