When we started the development of Icinga 2 we had a clear picture. We wanted a great monitoring solution for small and large environments. Back then, we imagined Icinga 2 to be a scalable monitoring tool with a dynamic configuration, enriched with a slight and fast web interface. In fact, there were some more details to that. But let’s keep it short. We worked hard to achieve our goals. It was certainly not always easy, but we’ve always made sure that everyone pulls together, with full power and in the same direction. We knew our destination and successfully co-worked with our community through all hassles of the journey.
Of course Icinga 2 will never be finished. There are too many great ideas, features and fixes that need to be evaluated and implemented. You can say: There is always something to do. And when one fix is done another idea for improvement appears. That’s great! Nevertheless, what we wanted to achieve, the scalable and dynamic monitoring tool with the fast web interface, is there.
And now? How do you continue once you achieved a goal on your agenda?
You pull your socks up and get back to the drawing board to plan the next stations of your journey. That’s what we did and what we continue to do constantly. We’ve shared details about our plans for the short-term and the mid-term development projects. If you missed it, make sure to read the Summary of our Icinga Virtual Meetup.
Today we want to share our thoughts on the further evolution of Icinga. And, let’s face it. When you think about how you can evolve, you will definitely come across challenges.
Talking about Challenges
Dealing with challenges is part of our daily business. They come in many different shapes, forms and sizes. As a software company, fixing things is something that takes a major portion of our time. Without the help from contributors we barely would be able to keep up with all of them. During the past decade we’ve learned a lot about the software we build, but also about the challenges Icinga users have. Often they can be tackled with a bug fix. Sometimes they need a major release. And some challenges turn out to be huge. These provoke us to rethink and re-evaluate decisions we’ve made, priorities we’ve set and technical architectures we’ve built.
Here’s a list of just a few things that we come across regularly. These are the major challenges that will pave the way for the further evolution of Icinga:
Monitoring things that are not hosts or services
In infrastructure environments that are built the “traditional” way, as we call it, having a set of services assigned to a host works very well. It clearly separates one device from another and what you get is a straightforward overview, easy to understand and to monitor.
Monitoring technologies that can not be separated in that way become more difficult: any kind of clusters and the resources running on those, stacked network equipment, containers, pods, just to name a few things. The workaround is to create dummy hosts or dummy services within Icinga. This works okay, but it blurs the vision and things are not so clear anymore.
So, how can we bring clarity?
Visualizing infrastructure properly
Clarity is crucial when monitoring server infrastructure. To provide clarity, the different aspects and components must be displayed as such. A server should be identifiable as a server, a disk as a disk, a network switch, cluster or container as well. Only then administrators can easily understand what is going on and what they need to do to fix devices or applications that are down or broken.
We want to be able to distinguish and classify things at the very first glance.
Interpret and process the data we collect
The just mentioned challenge is connected directly to another one. Icinga is not just another pool for data. The data we collect has an actual meaning and helps you identify problems. To squeeze out the most important information from that data, it needs to be processed properly so it can be interpreted easily. Bringing clarity to a world where hundreds of thousands of servers, VMs and other things are managed by just a few operators is a very tough task.
We need to make sure to process data in the most useful way for all kinds of users.
Extend the actual monitoring capabilities
We’ve had an eye on flexibility and integrability from the beginning. Icinga 2 is extended either with built-in features and with monitoring plugins, notification scripts and event handlers. Icinga Web 2 is extended with modules. Other tools are connected with Icinga either through these ways or directly by using the Icinga API. But to extend Icinga with completely new monitoring capabilities, the mentioned approaches are still too limiting. Again we need to move on. Find new paths.
Notifications based on data collected by Icinga Modules
With the mentioned challenges in mind, we figured out that an appropriate way to extend Icinga’s capabilities is to evolve the way we extend Icinga with modules. Modules are the perfect solution for all above mentioned challenges. I’ll tell you why.
Modules allow us to collect specific data in a way that is performant, easy to use and maintain. Building modules such as the Business Process Modelling, Icinga Certificate Monitoring or Icinga for vSphere allowed us to broaden Icinga’s horizon. At the same time it brings the challenge of sending notifications with it. If you’re using Business Processes for example, you have to create a new check that checks this Business Process and alerts you when it’s in a problematic state, although the module for Business Process Modelling is aware of the state already.
Managing incidents
Modules have lots of detailed knowledge about your infrastructure. Knowledge that is helpful during outages and interruptions, basically during every incident. An incident is “an unintended event that disturbs normal operations”. This can be anything. A server is down or the whole data center is burning. The former can be identified very well by Icinga. You could also monitor the burning data center with proper hardware and Icinga, but you would still be notified about the servers that are down. Technically this is correct, but not so helpful for the firefighting operators. Managing incidents as such and giving administrators the information they actually need is tricky.
Managing users and contacts
Handling incidents is only possible when you get knowledge about them in the first place. Sending notifications requires that you manage a user base in Icinga 2. Giving access to Icinga Web 2 is done through users you manage in Icinga Web 2. This can be a user database in Active Directory or LDAP as well of course. Users and contacts are two different things right now, even though it’s the same users that receive alerts and log in to Icinga Web. Managing timetables for on-call schedules, holidays and vacations with changing team members and notification channels become a huge deal.
We don’t claim that these are all the things that would need a rethinking and re-evaluating process. There’s certainly more. But talking about these and other challenges, writing them down and communicating is something that helps us a lot to self-reflect. We don’t find it distressing. The challenges we know about drive us to become better every day. The challenges we know about are things we can tackle. Doing so, we always have in mind what we strive for: Bring value to our users.
Moving Forward
Now, that you have a better understanding about the thoughts we have, you might ask yourself: How do we move forward?
Our mission remains:
Enable users to build a tailored monitoring system that gives them access to meaningful data.
To achieve that we will have to make adjustments to current projects and build new ones.
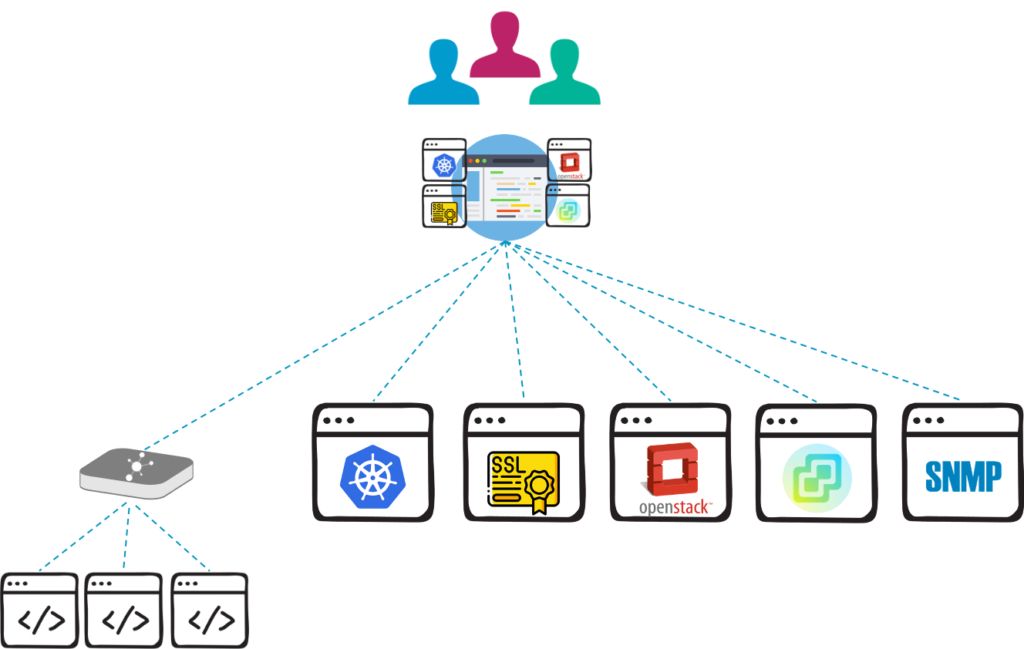
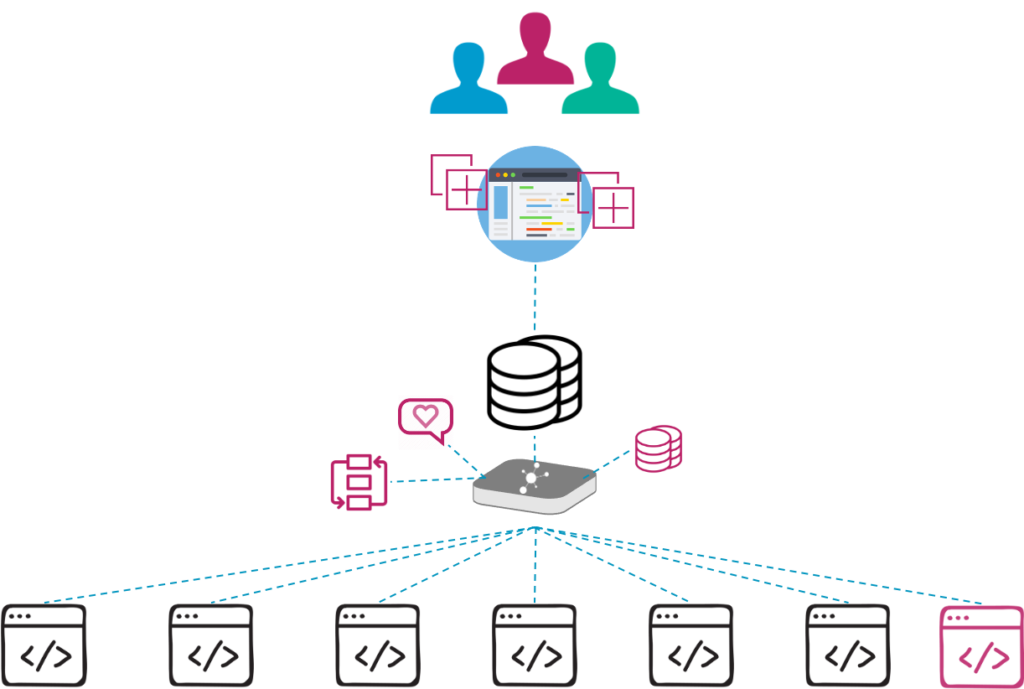
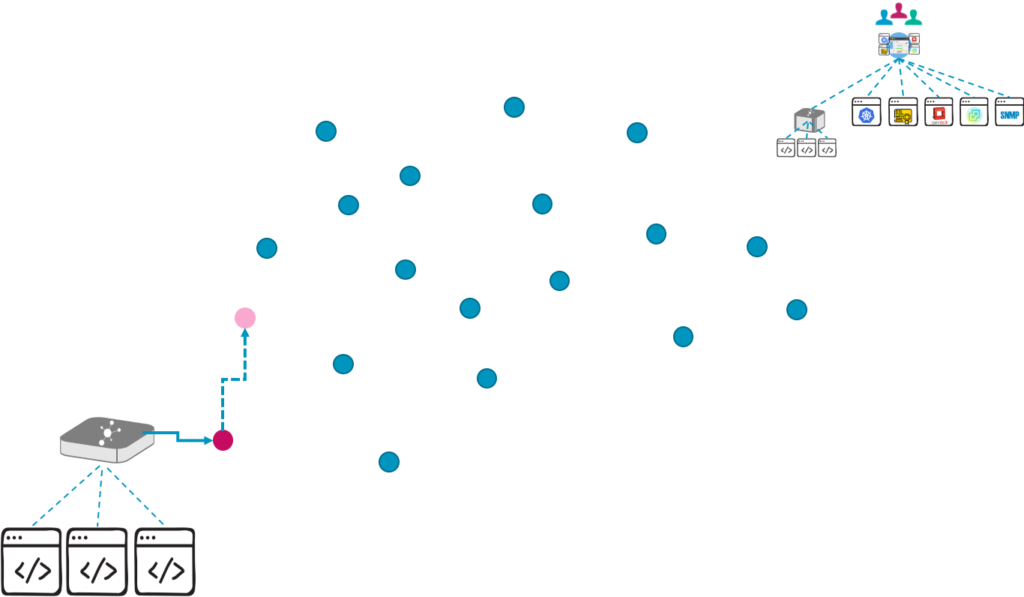
Icinga modules were initially intended to extend the Icinga web interface only. To extend the whole monitoring capabilities of Icinga we want to push that concept forward. Icinga modules of the future will be split into two parts. One part is to collect the data for the technology to be monitored. Since every application and architecture differs from others, building specific collectors enables us to collect the required information in a way that works perfectly for each individual use case. The collected data will be processed by the collector to extract the important information and store it in a dedicated schema.
This leads us to the second part of a module: Extending the Icinga web interface. By storing the data in a schema that was built for it, we can visualize it properly in Icinga Web. At the same time we keep the velocity and simplicity of the Icinga web interface and allow users to exactly choose what they need for their monitoring environment and leave out what they don’t need.
Icinga 2 remains to be an important component to monitor traditional server infrastructure. It’s concept has been proofed so many times. Icinga modules exist with equal value in parallel. They allow us to include different fields and evolve the whole Icinga universe at the same time.
Generally speaking, we want to achieve our mission by developing modules that collect data for all kinds of technologies, and visualize and process it in Icinga for fast and clear insights.
Icinga Events
But we want to go even further with this solution. In addition to allow proper visualization of the infrastructure, modules need to be capable to create dedicated events – Icinga Events. Those events should be meaningful and tell you exactly what is happening, for example “Problem X occured on cluster Y”.
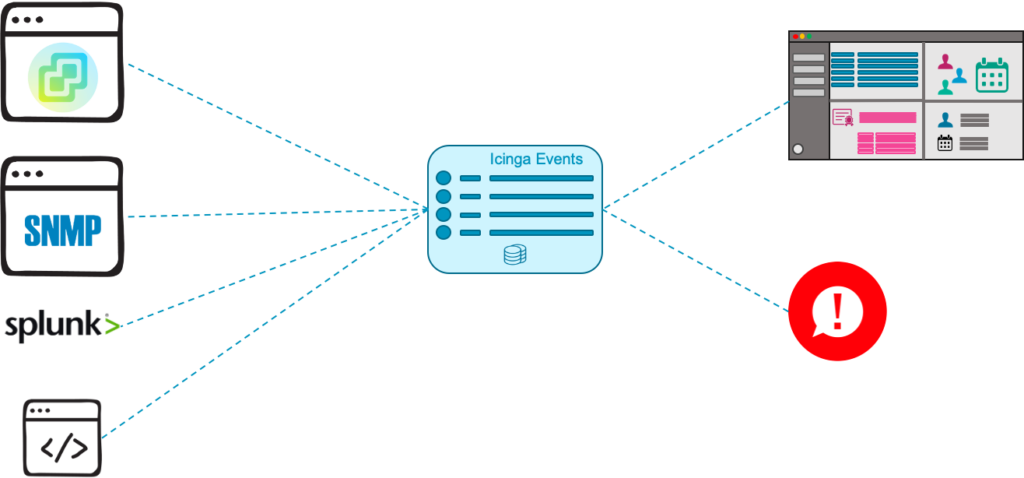
Icinga Events should not only be used by Icinga modules. Rather, we want an open API that we use for our modules, but which at the same time can be used by third party tools as well. Handling events the Icinga way does not mean collecting each and every log file. There are plenty of very good solutions for that, with some of them Icinga can be integrated very well. Icinga focuses on those events that you can act on, maybe even as a result of logs or metrics that you collected somewhere else.
Displaying and managing events is the first step. Acting on those events is the next one. Acting includes receiving alerts and notifications in the first place. The functionality is broadened by allowing you to combine events from different sources and use the information to draw a comprehensive picture of incidents.
We are lucky to be able to experiment with a first implementation together with a long term customer. This allows us to research and learn about possibilities and pitfalls. We can’t wait to publish our first results and share our concepts on the matter.
Known Unknowns
We’re drawing a picture of Icinga as the solution that allows you to build the monitoring environment that fits your needs. Monitoring traditional infrastructure combined with the new one you’re currently building: everything under one and the same roof.
We continue our journey by identifying our next stations. Which exact road we will have to take, remains open. There are plenty of challenges coming towards us. Some of them are clear already and on our radar. Other challenges will appear during that journey and we will have to find solutions on the fly. But one thing is very clear: We want you to be part of our journey.