When we hunt down problems in Icinga setups we ask for logs most of the time. While you get used to sifting through logs and collect some bash magic during the process there’s always the wish for this routine to be easier and especially faster. If you get logfiles from several days where each of the nodes produces millions of logfiles per day, every time you start your grep’s over and over get’s you madder and madder. So I started searching for a solution.
Having experience with Elastic Stack setups I always wanted to have an easier way of parsing Icinga logs with Logstash. I built some setups with some basic rules before but they were just starting points. The icinga module in Filebeat helps with that as well but it also just parses the metadata of the logfiles and not the logs itself.
Like every decent IT person ( 😉 ) I run my own installation of Icinga and Elastic Stack for my personal systems so one day I started building filters that would parse the Icinga logfiles as much as possible. When this project matured I decided that I wanted to open source it so everyone running the same combination could benefit. I tried making it as easily usable as possible so I added every bit of configuration you would need to the repository on GitHub. It’s all said in detail in the Readme of the project but what you basically need is to check out the repository in a directory, use this directory as configuration for a Logstash pipeline and use Redis (with predefined keys) to get the data into and out of this pipeline.
Meanwhile the project got a lot of attention from Alexander Stoll, an employee at Netways, one of our Icinga partners. This means, the project grows even faster and having a second pair of eyes looking at your code is always a great help. Thank you very much!
What you get if you apply this pipeline:
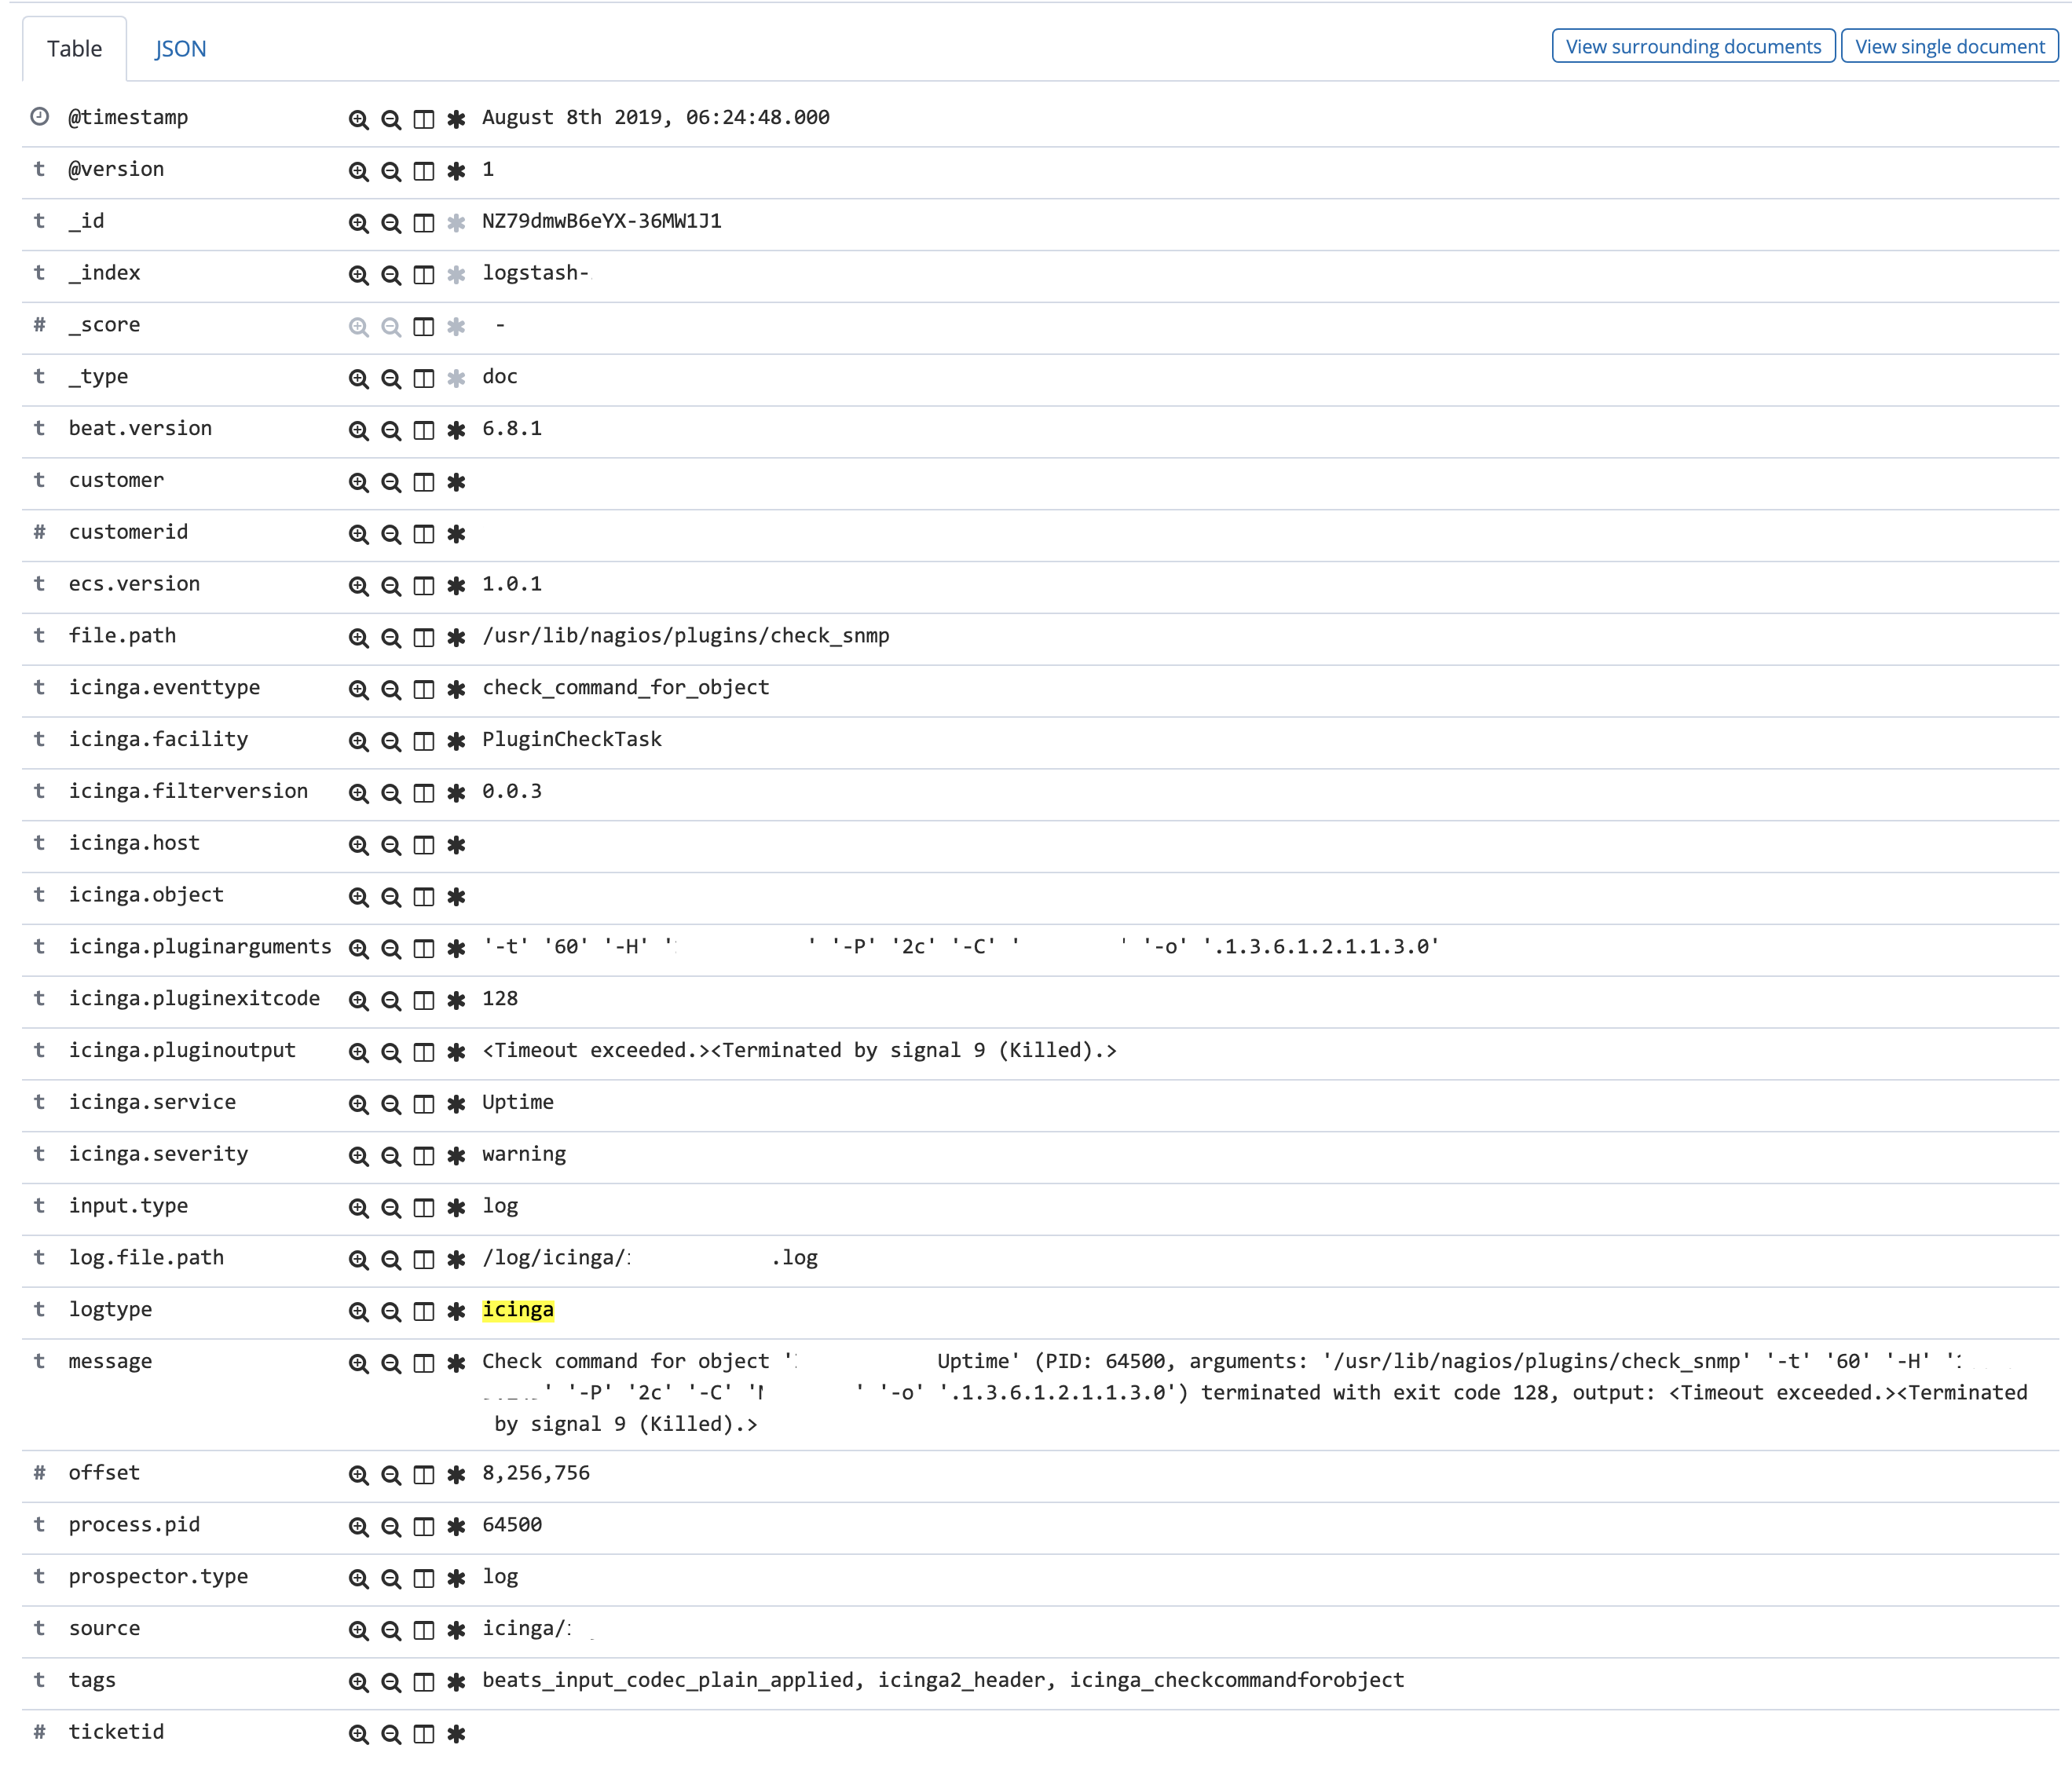
- More and more of all possible log events from Icinga get parsed. So you will get fields holding the information about the host/service/object an event refers to, queue lengths, pids, timestamps and so on. You can build your own dashboards out of this information or just use the example ones the project is providing. They are great for filtering your events, too.
- The pipeline tries to follow the Elastic Common Schema as closely as possible. So you will be able to use your logs for upcoming features like SIEM
- The pipeline adds a field called
eventtypeto every event, so you can filter more easily and there’s even the possibility of having a knowledgebase to all the events when there’s enough interest (and help) from the community - You get information like the host writing the log or the Icinga facility providing the information. This can be used for filtering more easily for the information you really need. Of course the severity has also its own field and filterable

What this ruleset brings is not only the possibility of users parsing their own logs but one big benefit for Icinga partners providing support. Netways has set up a centralized Elastic Stack running in Netways Web Services where their support squad can access logs we have been sent by their customers. To get the logs into this centralized system they use a dockerized Filebeat installation which reads some extra information (customer id, ticket id) from an .ini file and adds them to every event.
The Elastic Stack uses this information not only as part of the events being written into Elasticsearch but also to create the index name where the information is written, too. This way they stray from the default where the index name has a timestamp (or increasing counter when using ILM). This leads to indices having very different sizes which doesn’t matter because they don’t need a tuned high performance stack in this case. But they get the benefit that they can cleanly delete all logevents about one specific ticket when they are done.
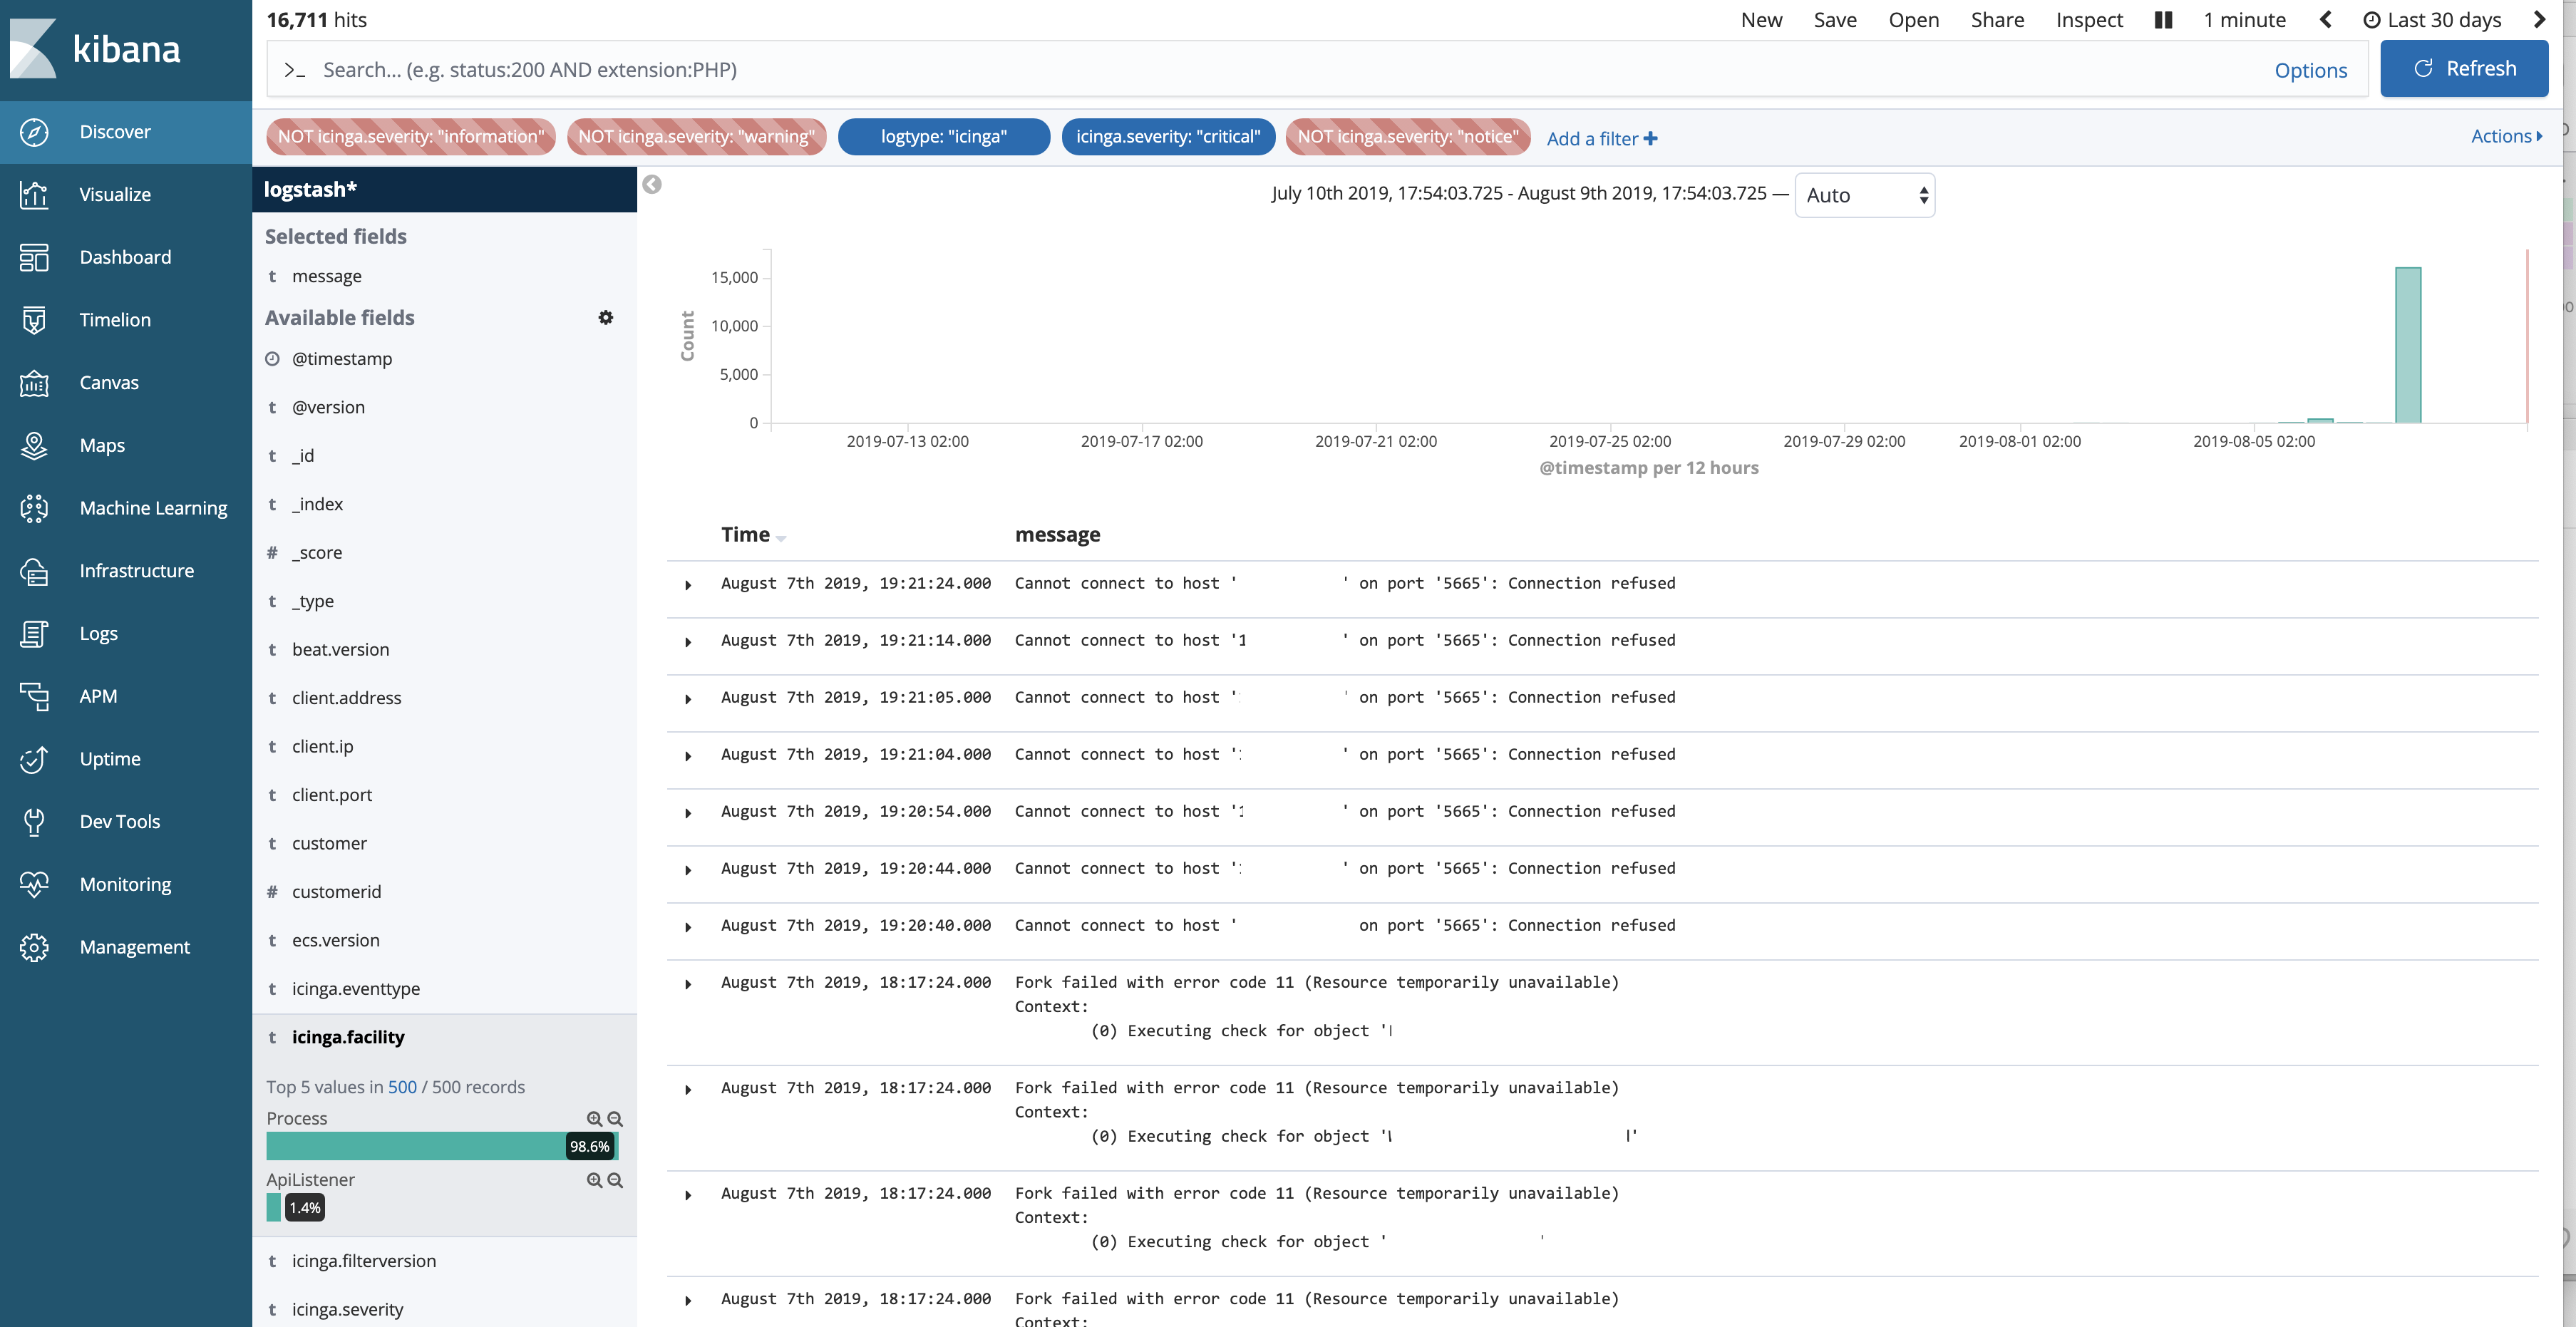
As an example what you can do with this setup: There was a ticket about a problem with notifications being triggered despite an object being in downtime. So the customer sent all logs from their Icinga masters and the agent involved. All of them where sent to the centralized setup (with the filename of the log representing the server name) and they started digging. Narrowing down the window of events being shown to the timeframe from when the downtime was created and when the notification was triggered helped in the first place. Searching for the name of the agent being involved showed the downtime being created and the notification being sent.
They could easily change between several levels of information and get more or less information for debugging. Since the information came in more than 40GB split into several logfiles it would have taken them quite a long time to refine their search every time they wanted to change something. Using the Elastic Stack they could make changes within seconds.
As with every open source project feedback is always very welcome. Be it mails, issues on GitHub or Pull Requests. Things like this exist for the community and through the help of the community. By now there are not all possible events being parsed but the ruleset get more and more complete over time. If you find events with the eventtype undefined please consider writing rules and issuing a pull request. By the way – during the process of working on these rules we discovered one or another way to improve logging in Icinga itself, and created issues or pull requests.
If you want to meet and have a chat about combining monitoring with logmanagement you can catch me at the upcoming Icinga Meetup in Linz, Austria or listen to my talk about this very topic at the Icinga Camp in Stockholm, Sweden.